From isolated scores to the stories underneath
Organisations we work with are often already collecting data from their people.
What these numbers rarely tell you is how they connect - or the picture they add up to. A score gives you a snapshot. It rarely tells you the whole story: the shape of how your organisation is doing, and where to put your attention.
That's where States of Vitality begins.
Typical surveys
Data without context
States of Vitality
See how everything relates


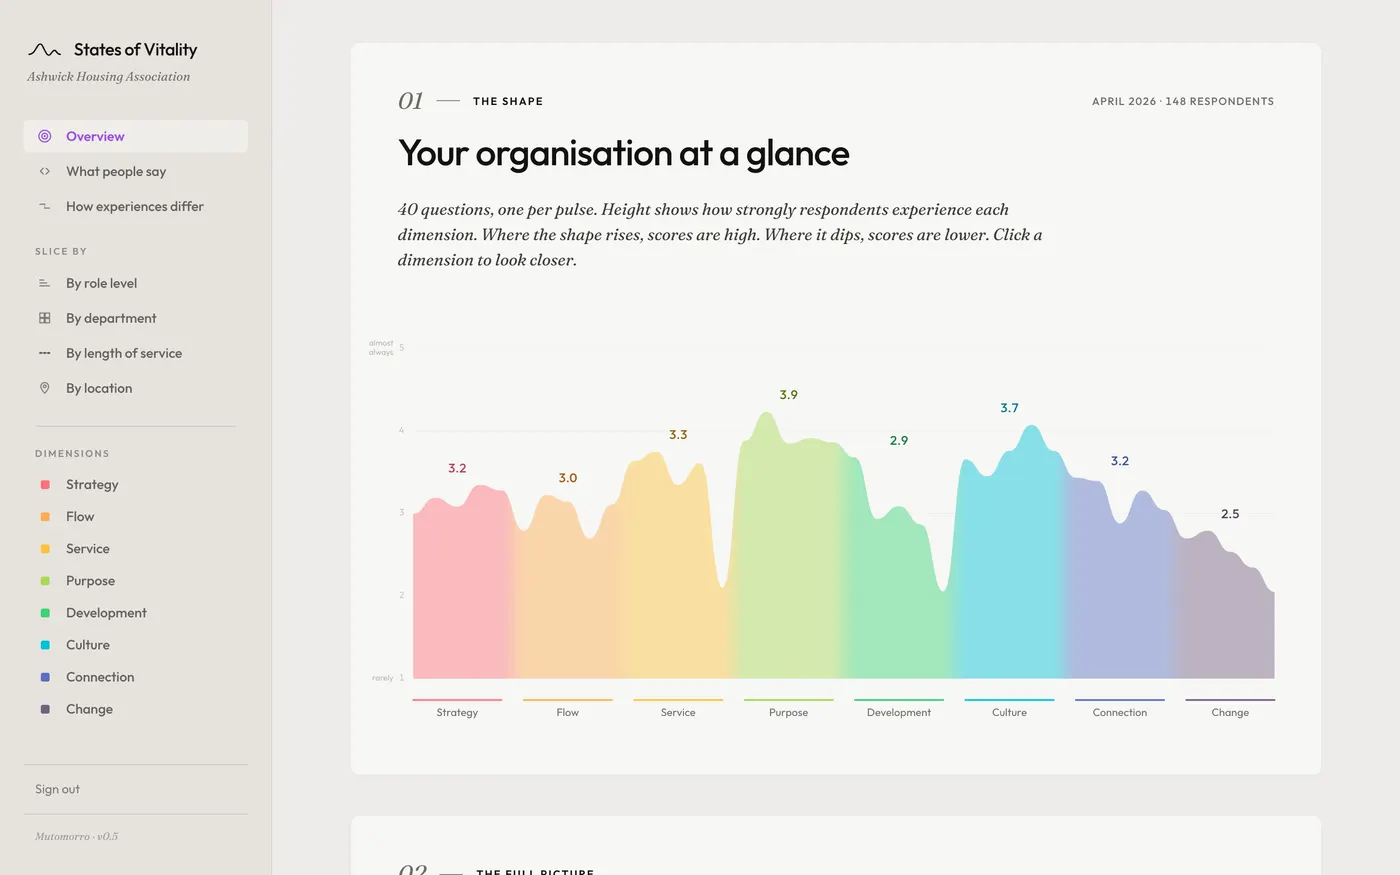
Eight dimensions, one connected view
Built on the EMERGENT Framework, the assessment examines eight dimensions that shape organisational health - from strategy and purpose through to culture and how you navigate change. Each dimension tells part of the story. Together, they reveal the whole picture.
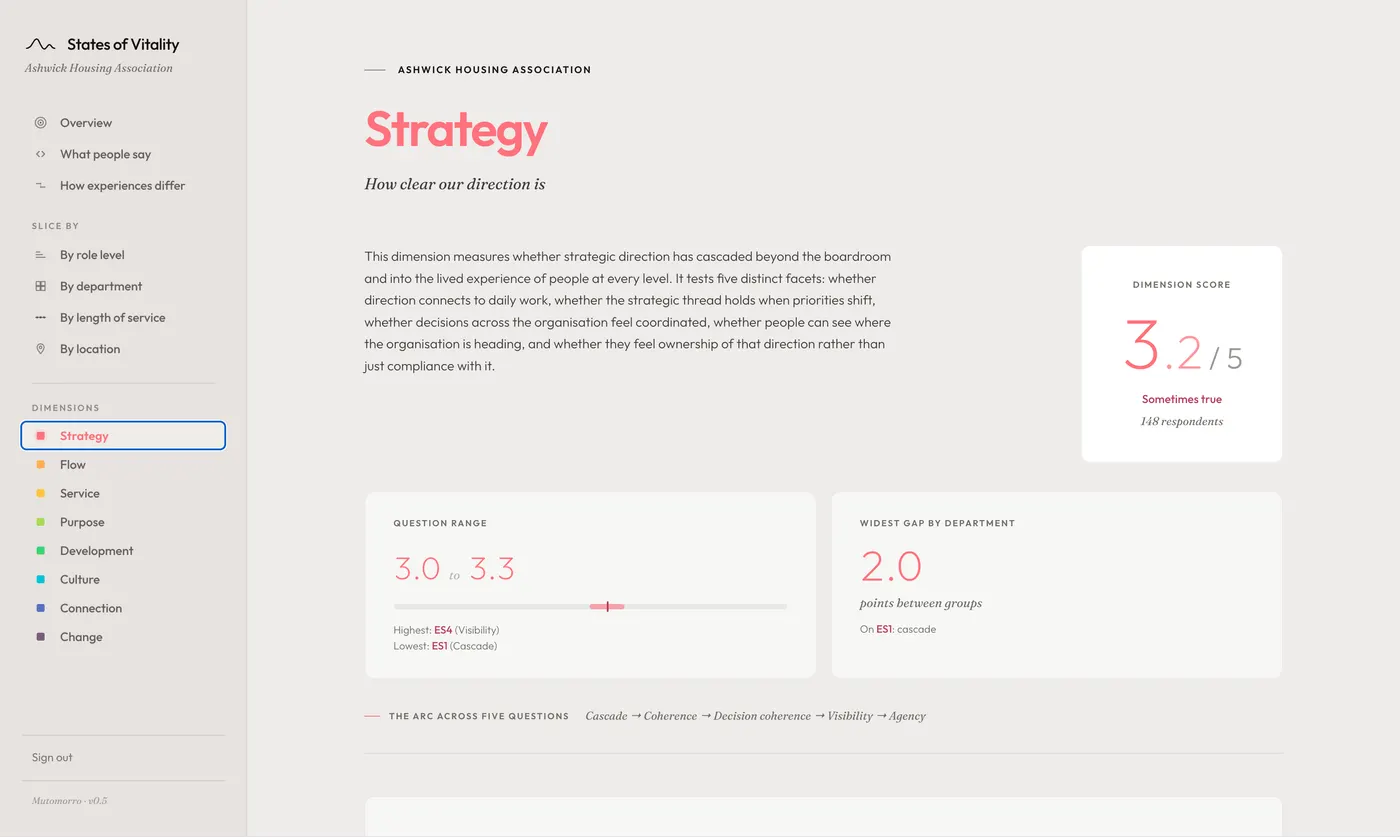
Strategy
How clear your direction is
Flow
How easily you get work done
Service
How you create and deliver value
Purpose
What drives you and guides your work
Development
How you grow people and build capability
Culture
How it feels to work here
Connection
How stories and meaning flow
Change
How you adapt and evolve
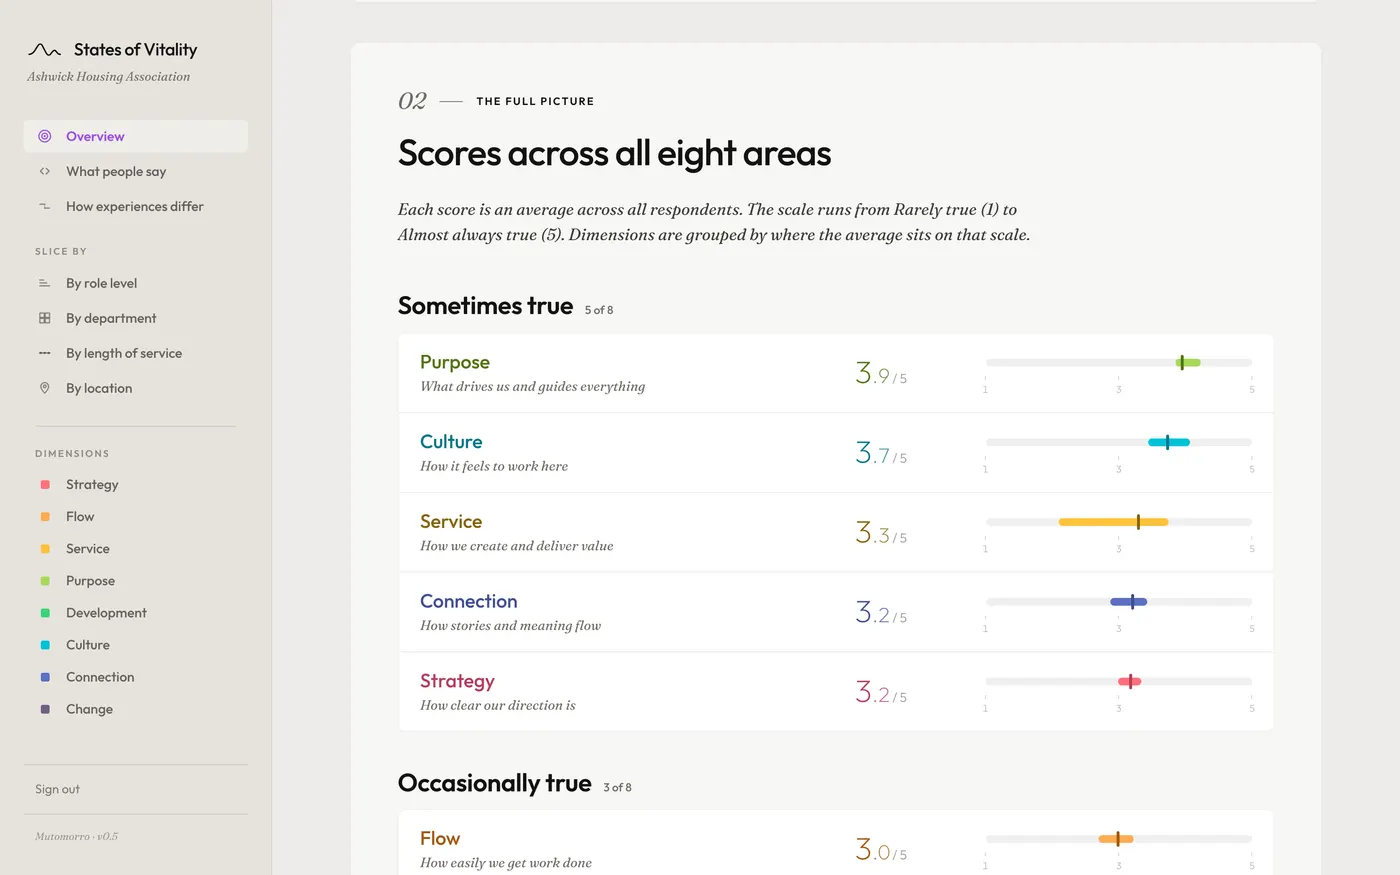
Every question uses the same simple scale: how true is this statement in your experience? Responses run from Rarely true (1) to Almost always true (5).
A different kind of assessment
Three things set this assessment apart from typical organisational surveys:
Everyone participates
This assessment brings together perspectives from across your entire organisation - every level, every function - into one coherent picture of how things actually work.
Built on systems thinking
Organisations are ecosystems where everything connects - a strain in one area often shows up in another. The assessment reads all eight dimensions together, so you see the whole picture rather than eight disconnected scores.
Know where to focus
Data alone doesn't drive change - clarity does. The assessment surfaces your strengths and the areas that need attention - so you can see clearly where to put your focus.
What would change if you could see your whole organisation - not just the parts leadership is close to?
Reveal what leadership can't see
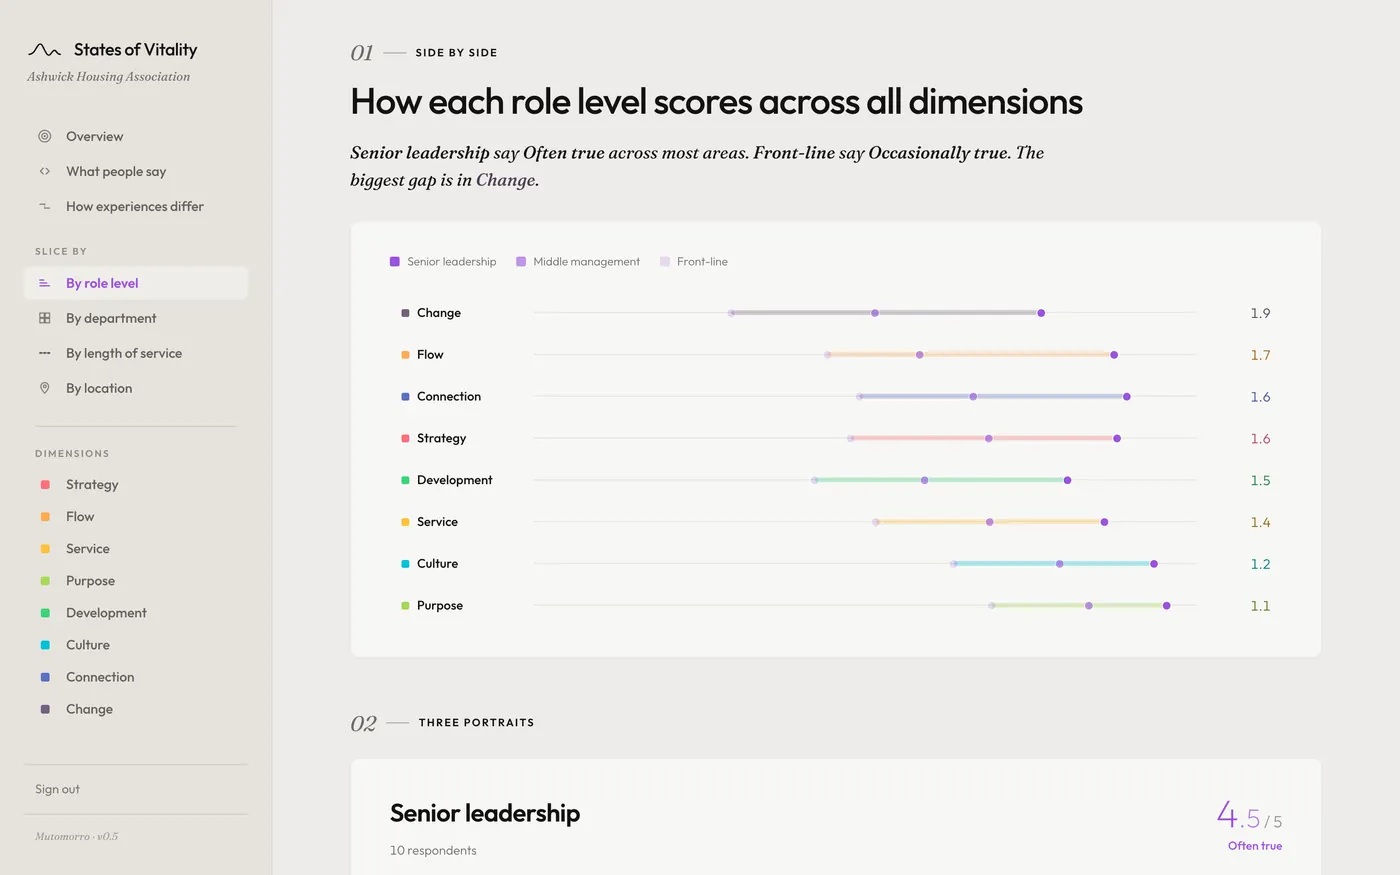
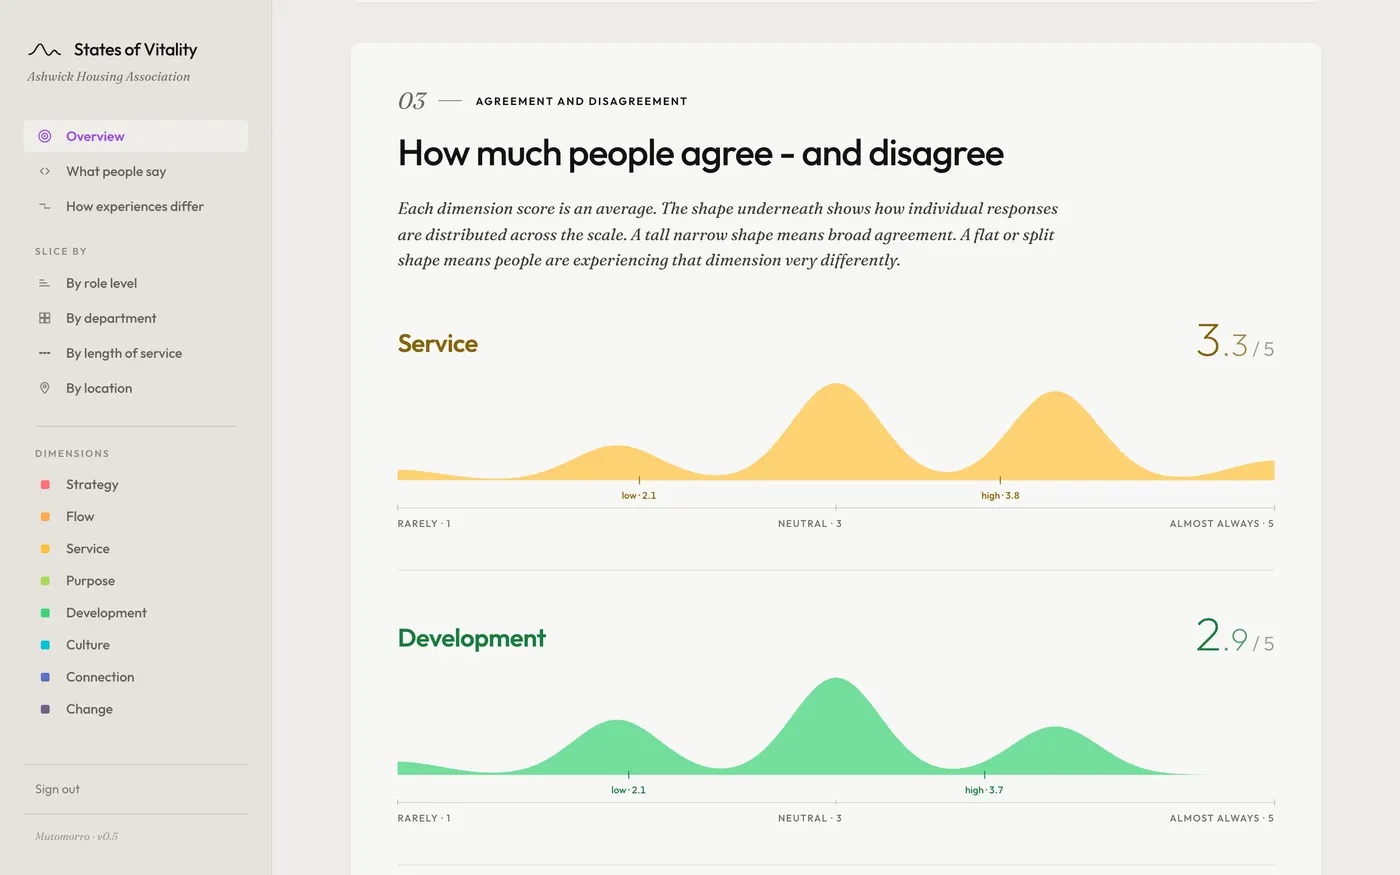
The same dimension. Different experiences depending on where you sit.
When we measure across role levels, departments, locations and length of service, patterns emerge that aggregate scores hide. Leadership might see confidence in a given area. The front line might experience uncertainty. The gap between them tells you something important.
82% of executives rate their culture good or excellent, against 47% of individual contributors.
SHRM, The State of Global Workplace Culture in 2024
One assessment, many applications
Because it looks at your whole organisation as a connected system, the assessment provides valuable insight across a wide range of contexts.
How it works
The assessment follows four straightforward stages:
Setup and launch
We configure the survey for your structure and ensure questions fit different levels.
Organisation-wide survey
Everyone completes the assessment - it takes around 10-15 minutes, and is designed to be finished in one sitting.
Analysis and reporting
Results land in your interactive dashboard - patterns, perception gaps and freeform responses ready to explore.
Session and planning
Walk through findings together and agree where to focus next. Optional consultancy support.
Total process time
Approximately 4-5 weeks
From launch to results in your dashboard
What you receive
Every assessment includes a configured survey, an interactive dashboard for your team, freeform response capture and demographic analysis. Consultancy support is available as an optional add-on.
What every assessment includes
Configured survey
Tailored to your organisation structure - role levels, departments, locations and length of service.
Interactive results dashboard
Secure access for your team. Explore results by dimension, demographic group, or single question. A tool your leadership will actually use.
Freeform response capture
Hear what people say in their own words, alongside the numbers. Shown as written, not scored or sorted into themes.
Demographic analysis
See how experience differs across role level, department, length of service and location - patterns aggregate scores hide.
See the full product at statesofvitality.com →
Optional consultancy add-ons
In-depth written report
A detailed analysis across all eight dimensions with plain-language interpretation and prioritised recommendations.
Facilitated leadership session
A working session to explore findings, build shared understanding, and agree priorities.
Development and action plan
Where effort will create the greatest impact - sequenced, sized and ready to commission.
Ready to see your organisation clearly?
The full product - the one-minute film, the interactive dashboard, and an indicative quote - lives at statesofvitality.com.
More on the product at statesofvitality.com →