Empathy map
An empathy map is a collaborative visualisation tool that captures what we know about a user's behaviours, thoughts, feelings, and motivations, helping teams develop deeper understanding and more human-centred solutions.
Get the free template
An empathy map helps you organise what you know about a person - what they say, think, do, and feel - into a single, shared picture. It's one of the simplest tools in user-centred design, and one of the most useful for getting a team to look at the same person together.
What is an empathy map?
An empathy map is a four-quadrant visual that captures what you've learned about a specific person in a specific context. The four quadrants are Says, Thinks, Does, and Feels - each one representing a different dimension of someone's experience.
Dave Gray of XPLANE developed the format in the early 2000s as a way to synthesise user research into something a whole team could see and discuss. It became a standard tool in design thinking practice, and has since spread into product management, service design, and organisational development.
The empathy map works because it does something deceptively simple: it takes scattered observations, interview notes, and research data and gives them a home. Rather than leaving user insights locked in one person's head or buried in a report, the map makes them visible, challengeable, and shared.
It's worth distinguishing empathy maps from audience personas. A persona captures who someone is - their demographics, goals, and behavioural patterns. An empathy map captures what someone is experiencing in a particular moment. The two complement each other, but they do different jobs.
How the empathy map works
The map divides into four quadrants arranged around a central person. Each quadrant captures a different layer of their experience.
Quadrant | What it captures | Ask yourself |
|---|---|---|
Says | What the person says out loud - their words, requests, and complaints | What do they say, and in what words? |
Thinks | The beliefs and assumptions shaping their behaviour, often unspoken | What might they be thinking but not saying? |
Does | Observed actions, behaviours, and workarounds | What do they actually do? |
Feels | The emotions present in the experience | What are they feeling - and where can you see it? |
Says

This is the most concrete quadrant. What does this person say out loud? What language do they use? What do they ask for, complain about, or repeat?
Capture direct quotes wherever possible. The exact words people use often carry more meaning than a paraphrase. Someone who says "I just need it to work" is telling you something different from someone who says "I want more features."
Look for patterns in language, recurring phrases, and the gap between what people say they want and what they describe struggling with. Pay attention to emphasis - what they bring up unprompted is often more revealing than their answers to direct questions.
Thinks

This is where you move from observation to interpretation. What might this person be thinking but not saying? What beliefs or assumptions are shaping their behaviour?
The Thinks quadrant asks you to read between the lines. When someone hesitates before answering, what might be going on? When they choose a workaround over the obvious path, what mental model might be driving that choice?
This is the quadrant where teams most often disagree - and that's the point. If everyone has a different read on what a person is thinking, you've found a gap in your understanding that's worth investigating further.
Does

What do you see this person doing? Not what they say they do - what they do when you watch them.
Document behaviours, actions, workarounds, and small routines. Someone who opens three browser tabs to compare options is telling you something about trust. Someone who writes notes on paper before entering data into a system is telling you something about confidence.
The Does quadrant is where the difference between self-reported behaviour and observed behaviour becomes visible. That gap - between what people tell you and what you witness - is often where the most useful insights live.
Feels

What emotions are present? Anxiety, frustration, relief, hope, boredom, confidence?
Feelings aren't always stated directly, but they're visible in tone of voice, body language, and the small reactions people have when things go well or badly. Someone who's anxious it might break again behaves differently from someone who's simply annoyed.
The Feels quadrant helps teams move beyond functional descriptions of problems ("the process is slow") toward understanding the emotional experience that sits underneath ("they feel powerless when they can't see what's happening").
How to use an empathy map
Before you start: gather your source material. The empathy map is a synthesis tool, not a research method. You need something to synthesise - interview transcripts, observation notes, support tickets, feedback, or session recordings. The richer your source material, the better the map.
Step 1: Choose your person and context. Be specific. "Parents using our booking system" is too broad. "Aisha, a working parent, trying to book a half-term activity at 10pm on her phone while her children are asleep" gives the team something they can see. Place this person at the centre of your map.
Step 2: Start with Says. Begin with the most concrete quadrant. Transfer direct quotes from your research. Use their words, not yours. This grounds the exercise in evidence rather than assumption.
Step 3: Move to Does. What did you observe? What actions did you see? Note the difference between what they said they'd do and what they did. Document workarounds and unexpected behaviours.
Step 4: Then Thinks and Feels. These quadrants require interpretation. Be honest about when you're inferring rather than observing. Mark uncertain entries differently if it helps - some teams use a question mark or different colour for interpreted insights.
Step 5: Look for gaps and contradictions. The map's value comes from what the four quadrants reveal together, not individually. Where does what someone says contradict what they do? Where does what they think conflict with what they feel? These tensions are where the interesting insights live.
Do this with your team, not alone. The empathy map works best as a collaborative exercise because different people notice different things in the same research. A developer, a designer, and a customer service lead will each see patterns the others miss. That shared synthesis is what turns individual observations into collective understanding.
For gathering the kind of rich, situated data that makes empathy maps come alive, contextual inquiry takes you into the person's own environment to observe and listen.
Empathy map in practice
A children's charity is redesigning its volunteer onboarding process. They've interviewed eight new volunteers and observed three induction sessions. The team gathers to map the experience of Priya, a first-time volunteer who signed up after her children started school.
Says: "I want to feel useful, not just tick boxes." "I wasn't sure what to wear." "No one really explained what happens after the training."
Thinks: Worries about whether she's qualified enough. Assumes other volunteers know more than she does. Wonders whether it's OK to ask questions during sessions.
Does: Arrives 15 minutes early to every session. Takes detailed notes. Checks the website FAQ repeatedly between sessions. Hasn't joined the volunteer WhatsApp group despite being invited.
Feels: Excited about contributing but anxious about getting things wrong. Slightly overwhelmed by the amount of information. Relieved when a more experienced volunteer introduces herself.
Looking across the four quadrants, the team notices a pattern: Priya is motivated and committed (arrives early, takes notes, says she wants to be useful) but is navigating significant uncertainty (checks FAQ, hasn't joined the group, worries about being qualified). The onboarding process assumes confidence that new volunteers don't yet have.
This insight - that the gap between motivation and confidence is the real design challenge, not the information itself - wouldn't have been visible from any single quadrant alone. It only emerges when you see all four together.
Limitations
It's a snapshot, not a story. The empathy map captures someone's experience at a particular moment. It doesn't show how their needs, feelings, or behaviours change over time. For that, you need journey mapping - and service blueprints can map that experience against the organisational processes that deliver it.
Interpretation carries bias. The Thinks and Feels quadrants require inference. Different team members will interpret the same evidence differently, and teams can unconsciously emphasise data that confirms what they expected to find. Name your interpretations as interpretations, not facts.
Quality depends on research quality. The map is only as good as what you put into it. An empathy map built from assumptions looks the same as one built from research - but it's far less useful. If you're finding the quadrants easy to fill, check whether you're synthesising evidence or projecting what you already believed.
One person, one context. Resist the temptation to create a single empathy map for "our users" in general. The tool's strength is specificity. If you have different user groups, make separate maps. A broad map smooths out the contradictions and tensions that make empathy mapping worthwhile.
Getting started
Pick one piece of user research you already have - an interview transcript, a set of support tickets, observation notes from a recent session. Draw four quadrants on a whiteboard or a shared screen, put the person's name in the centre, and spend 30 minutes with your team filling them in.
Start with Says (the facts), then Does (the observations), then move to Thinks and Feels (the interpretations). When you're done, stand back and look at the four quadrants together. The most useful question isn't "what did we write?" - it's "what do we notice when we see all four at once?"
The empathy map is part of Mutomorro's service and experience toolkit. If you're working on understanding the people your organisation serves - whether customers, service users, or colleagues - it's one of the best places to begin.
We regularly share thinking on organisational change and development on LinkedIn - ideas, practical approaches, and useful tools for people working on making their organisations better.
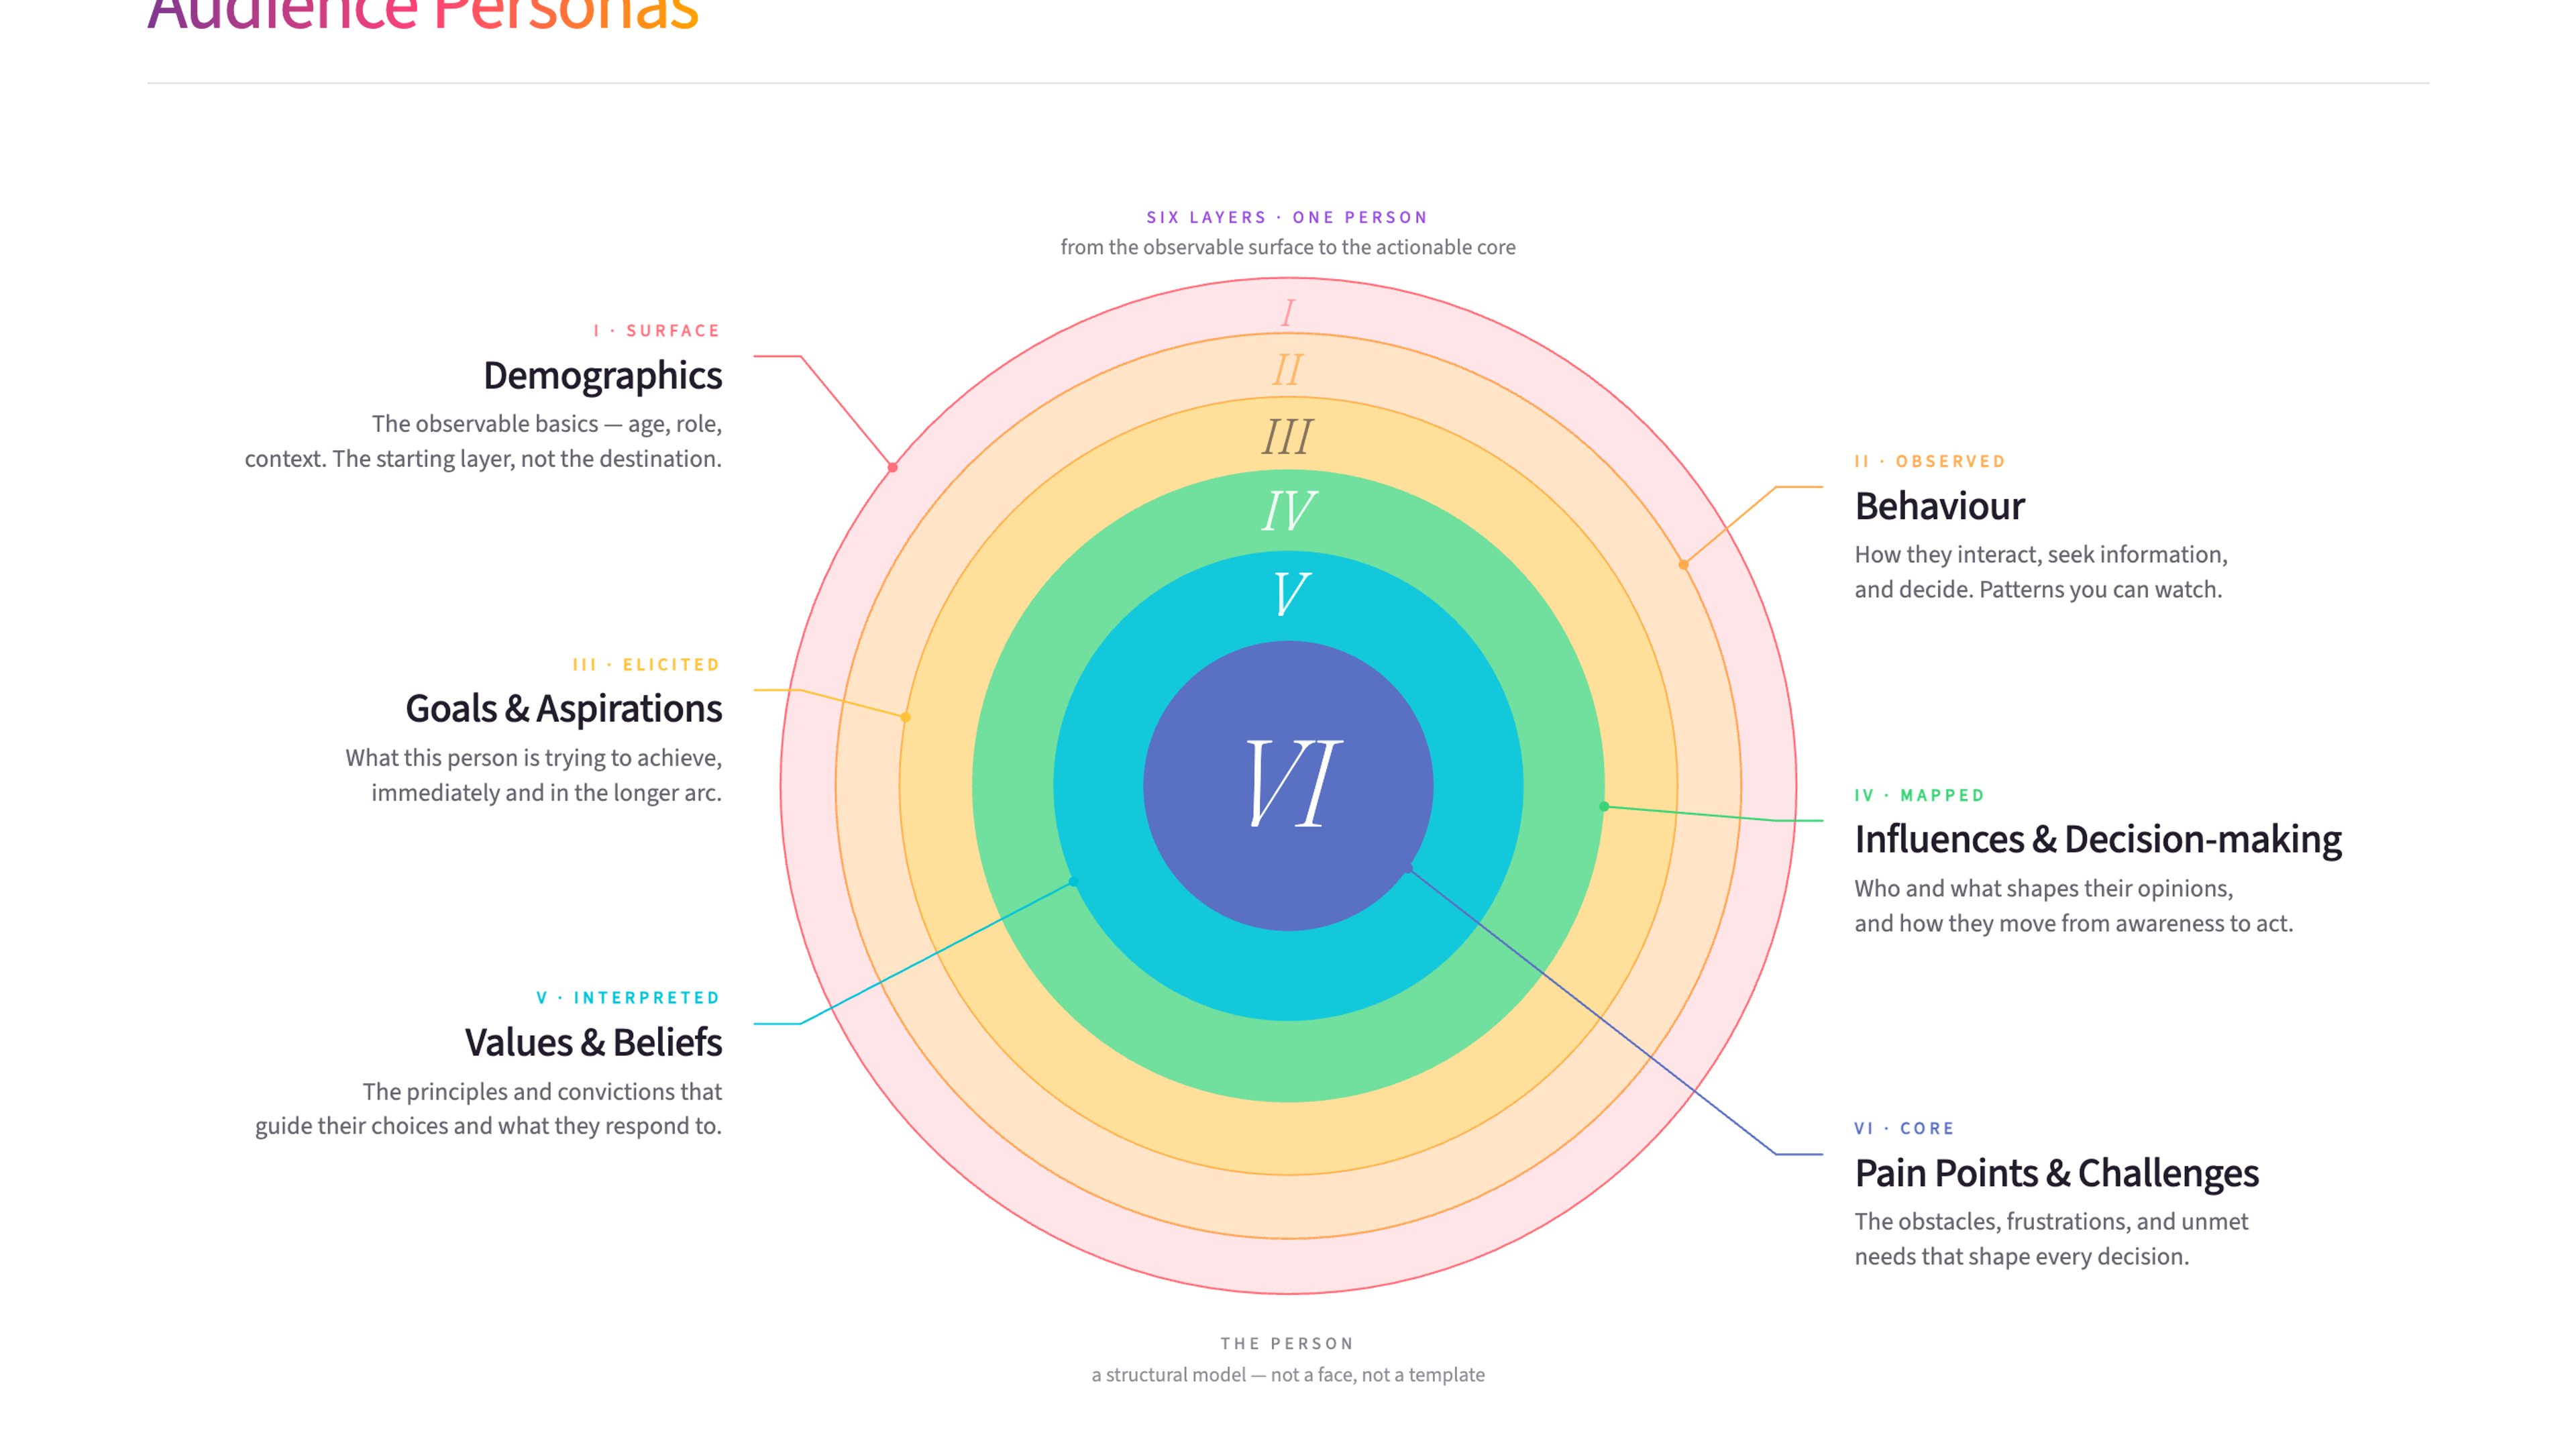
Audience personas are detailed profiles of the people you're trying to reach, built from real research into their needs, behaviours, and motivations. They help organisations design services and communications that actually resonate with the people who matter most.
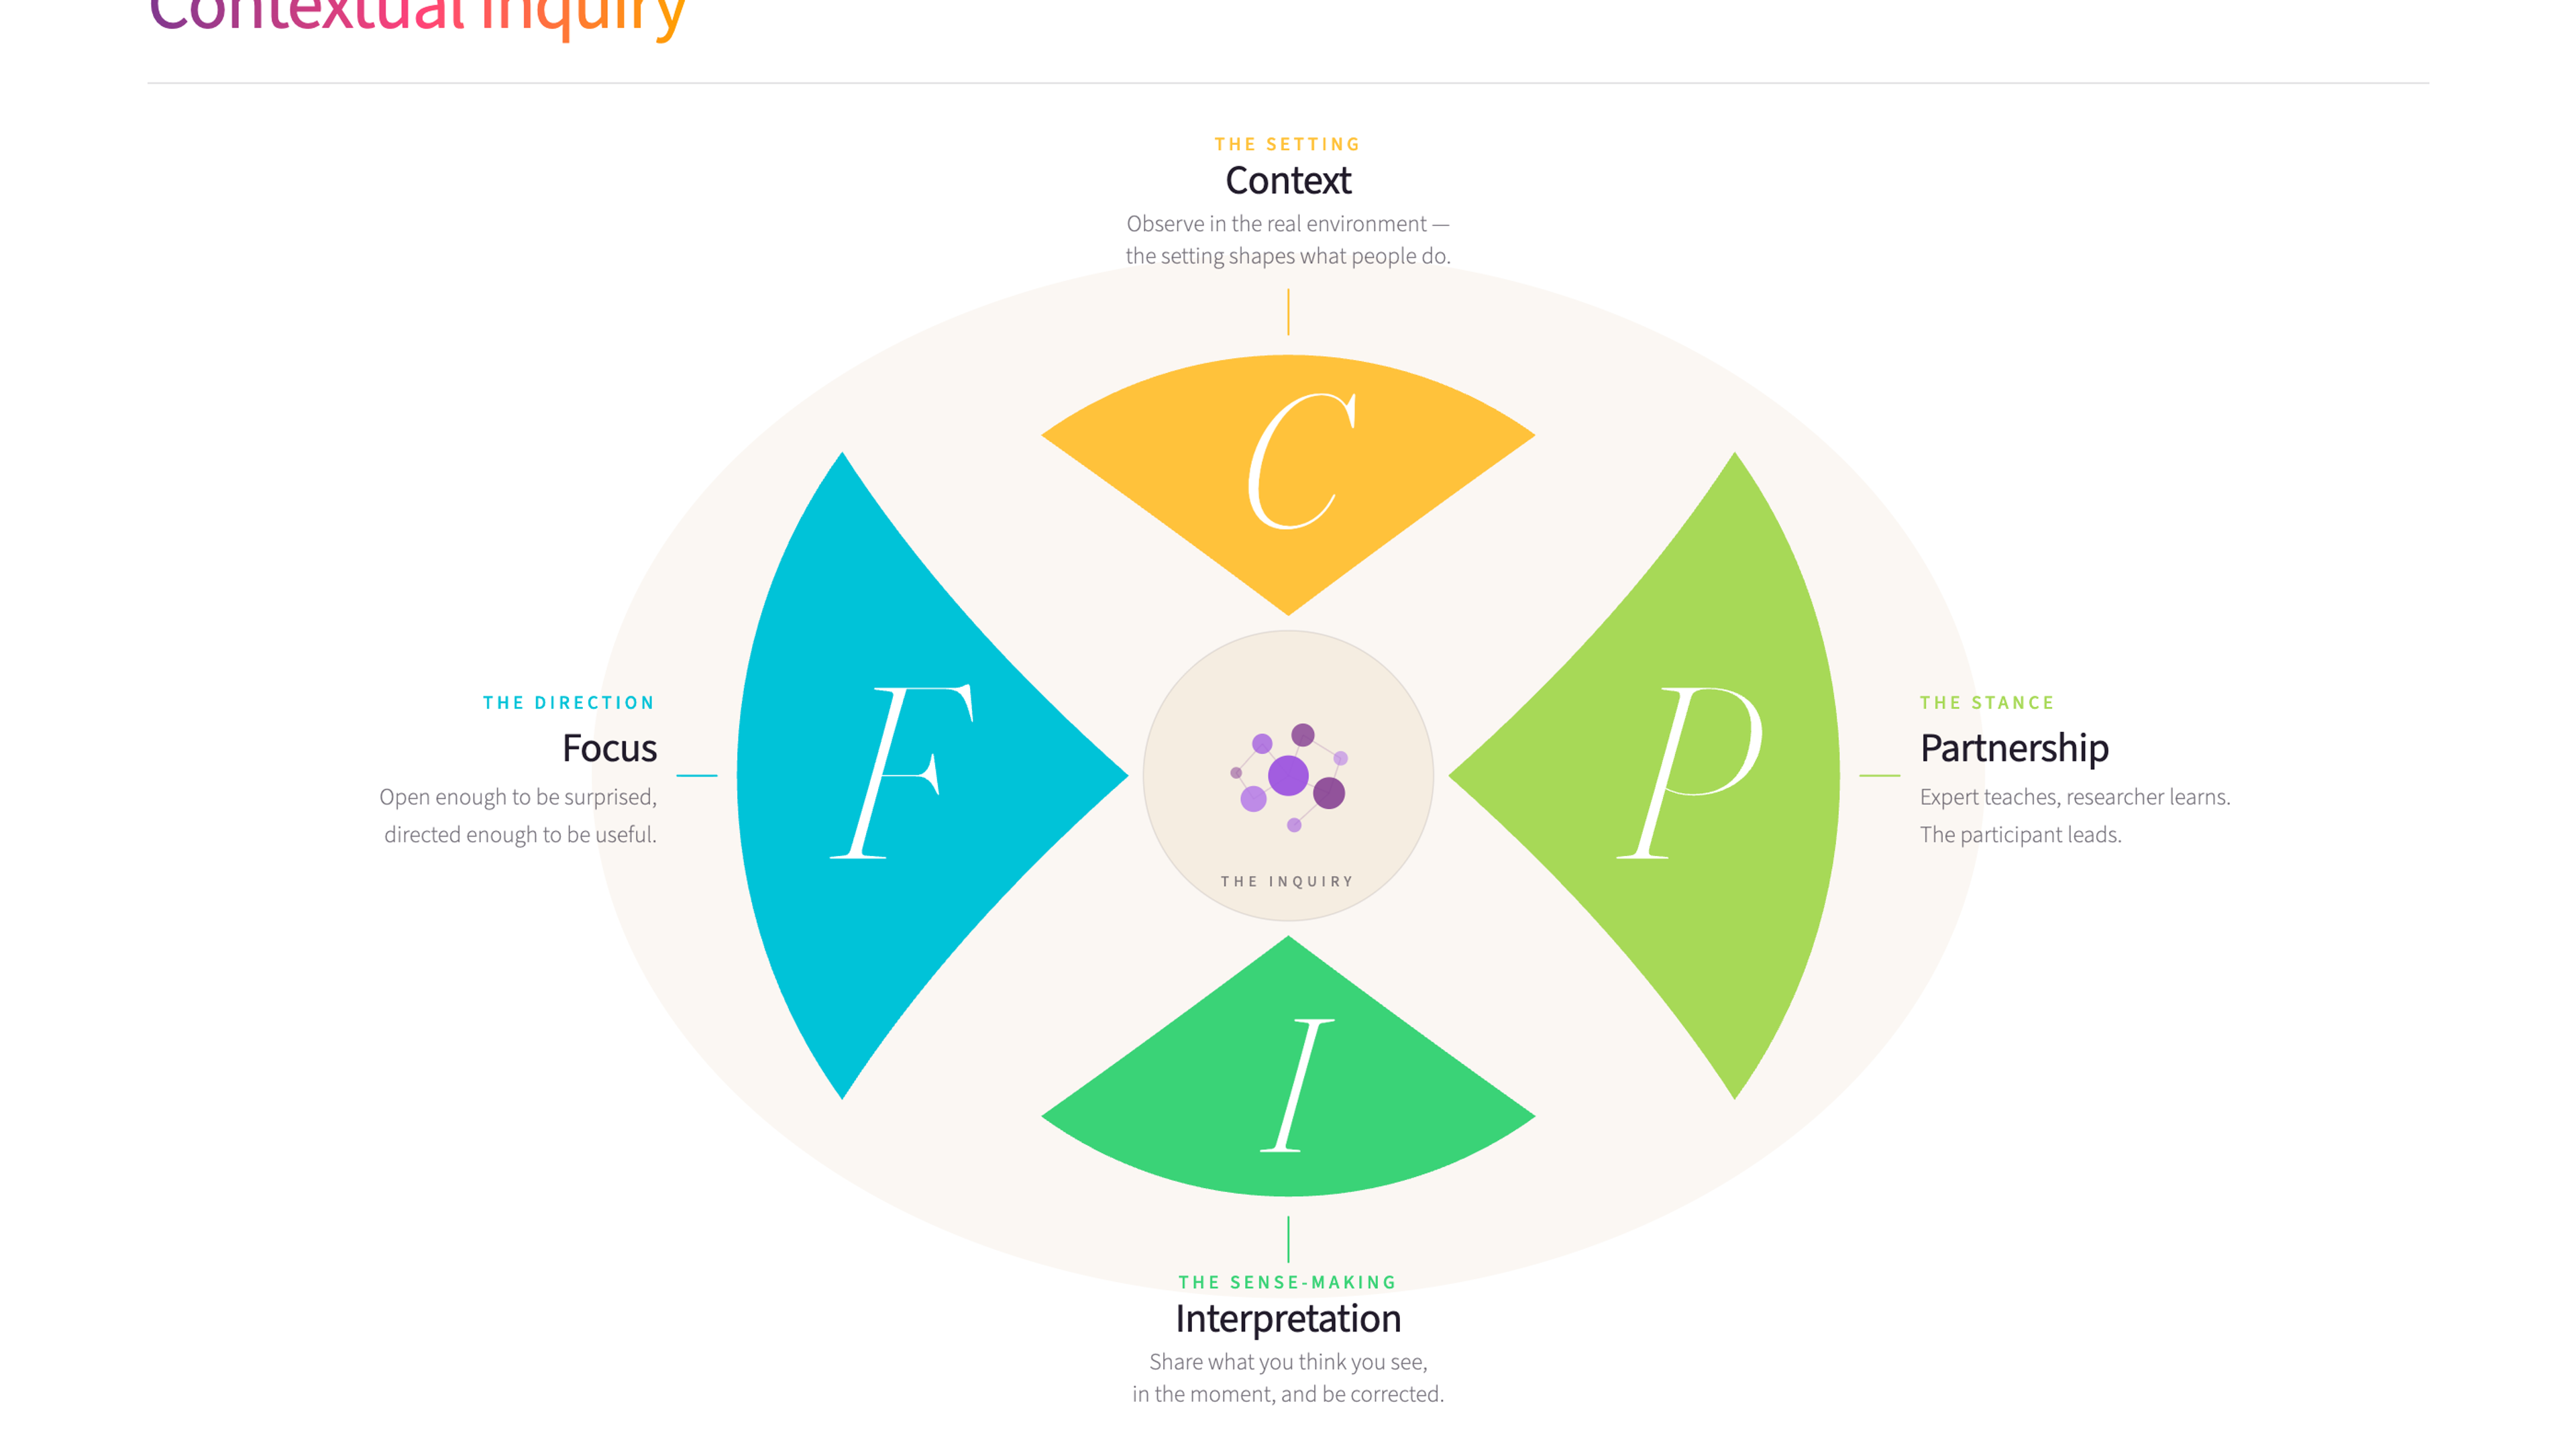
Contextual inquiry is a user research method where you observe and interview people in their actual work environment while they perform real tasks. It uncovers insights about real behaviour and needs that surveys and interviews in meeting rooms simply can't reach.
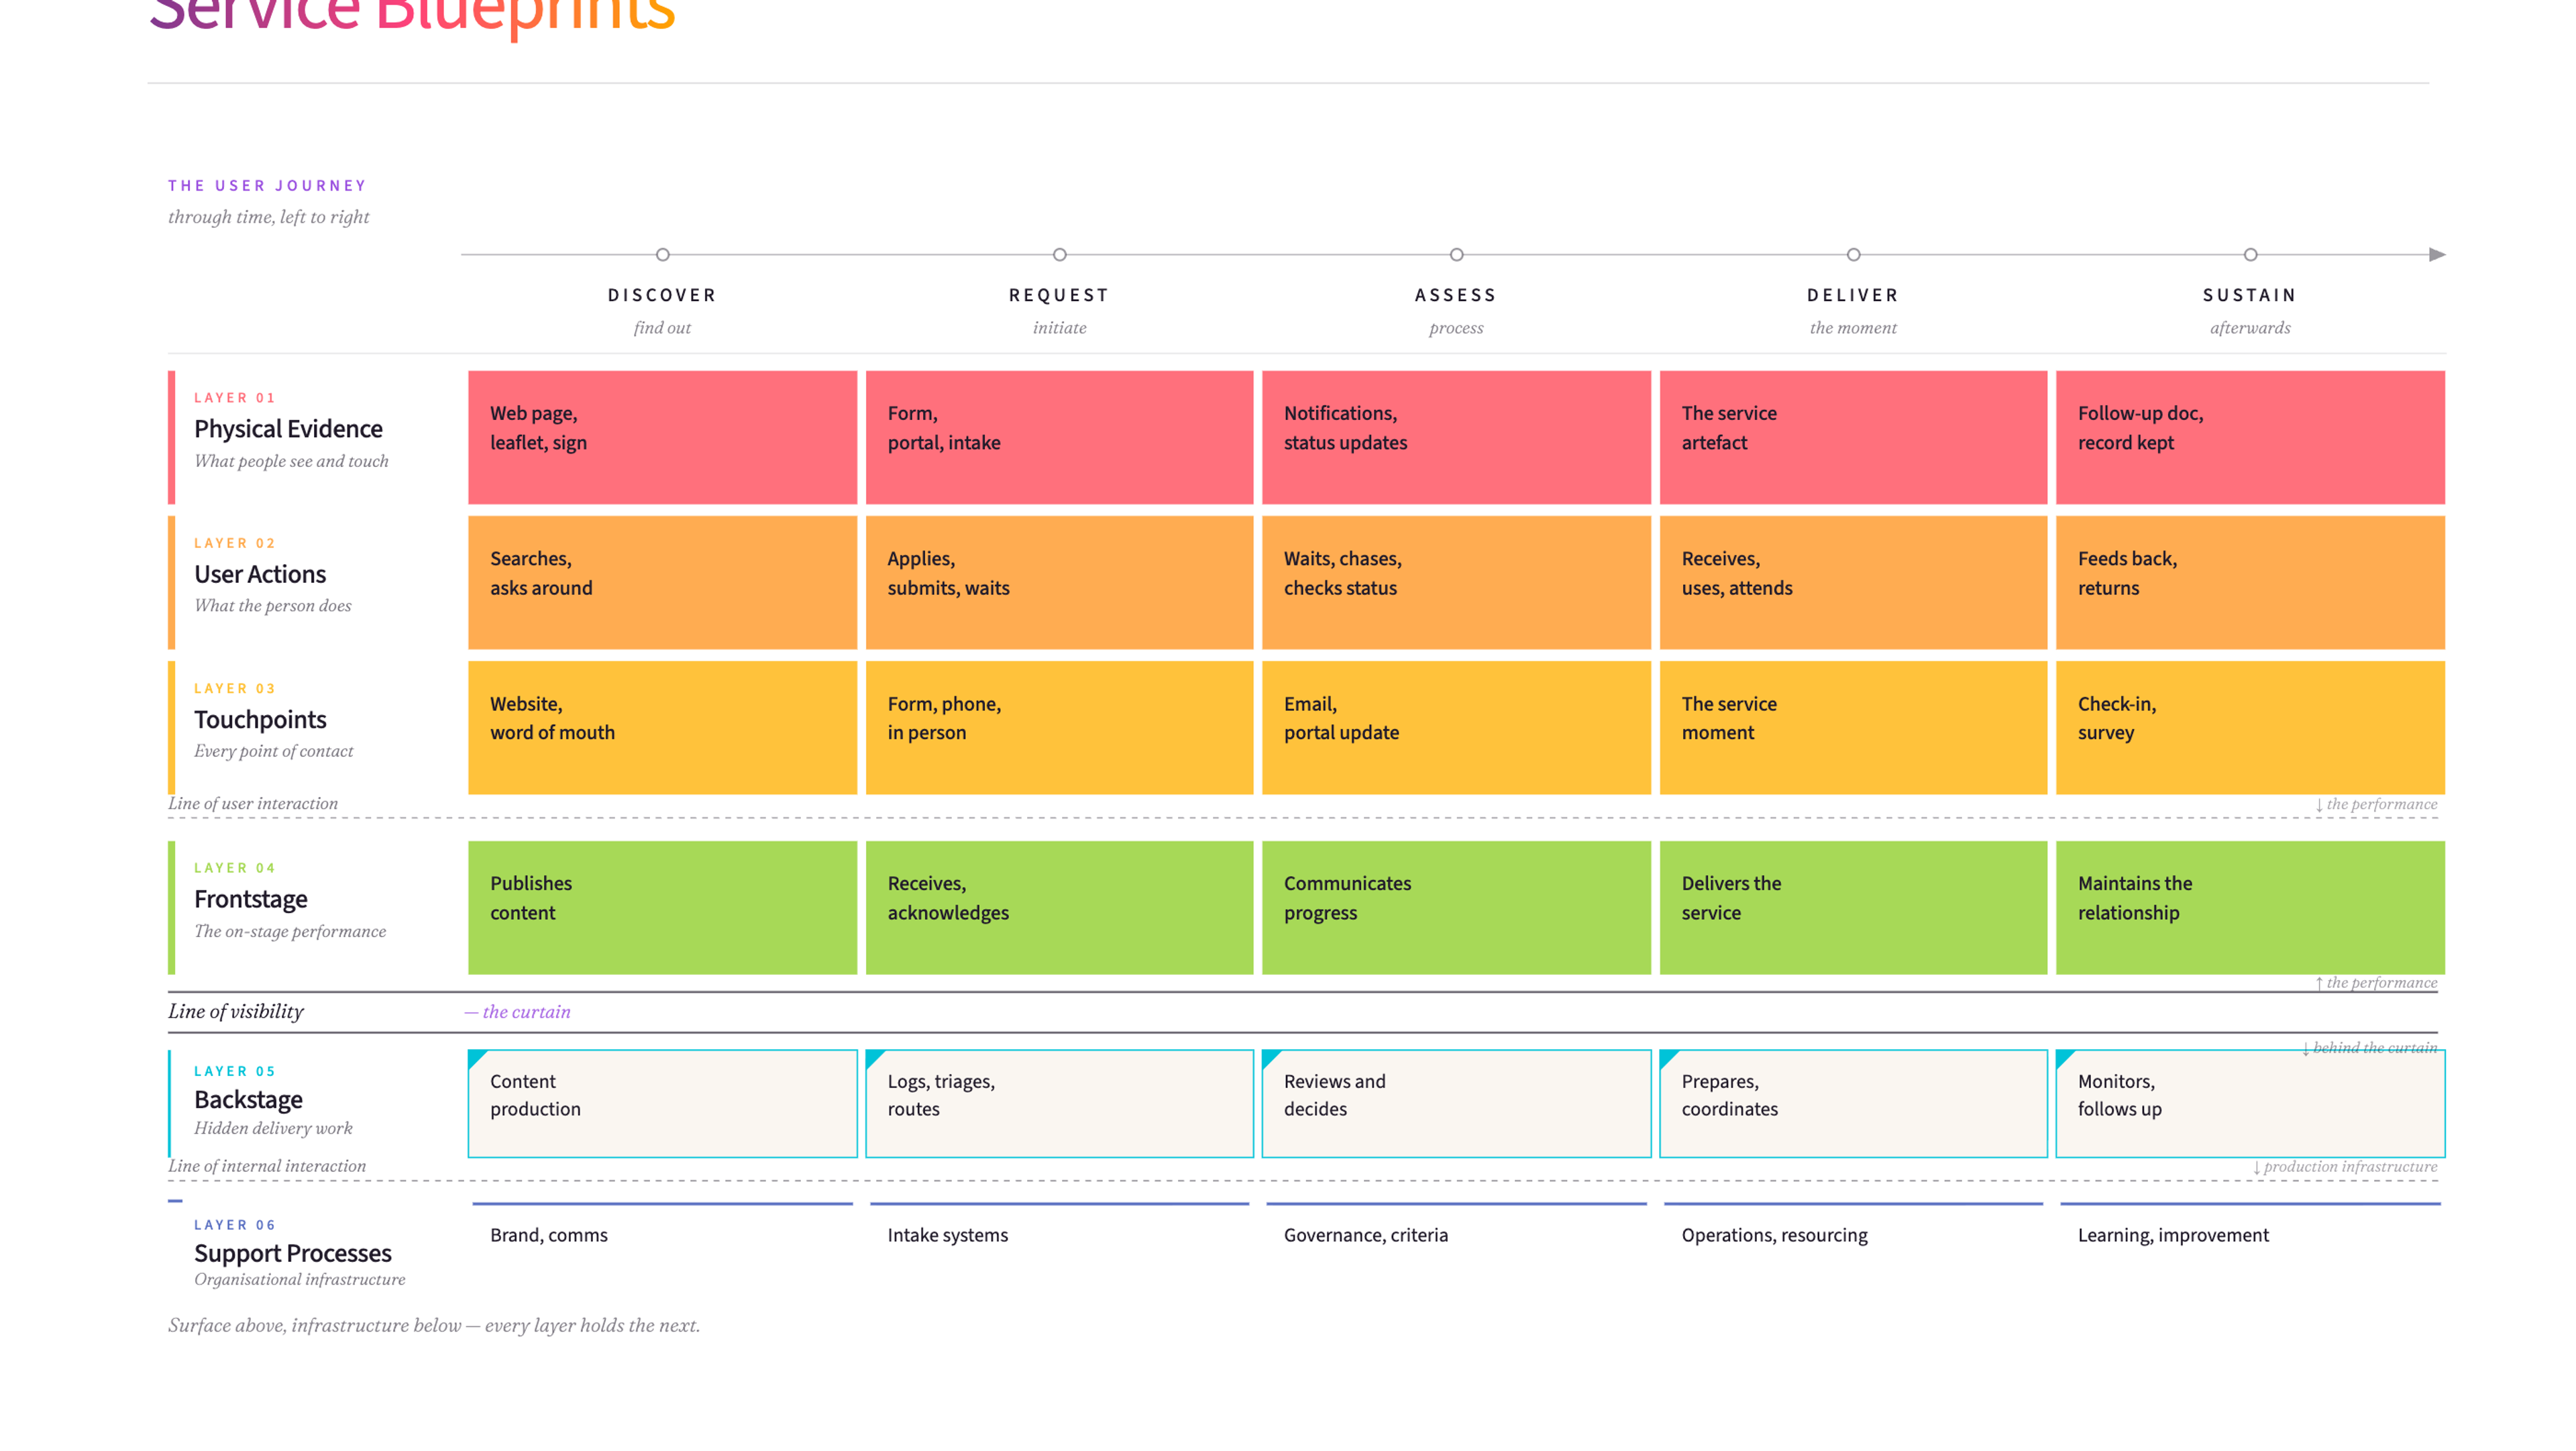
A service blueprint is a detailed map of how a service actually works - what the user sees and experiences on the front end, and everything happening behind the scenes to make it possible. It helps organisations redesign services by showing the full picture.

Customer Experience Training
Empathy maps help you see things as your customers do - one of several tools we use in our Customer Experience training.
James Freeman-Grayis the founder of Mutomorro. He's an organisational development practitioner who has spent over a decade working with leaders across public, private, and nonprofit sectors - helping organisations navigate change, strengthen culture, and design better ways of working.
I use empathy maps early in any service design work. They're a simple way to shift a team's perspective from "what do we want to deliver" to "what does this person actually experience." The valuable insight often comes from the gap between what an organisation thinks its customers feel and what they actually feel.
Last reviewed: June 2026
Ready to use Empathy map?
Download the free template - includes practical guidance for workshops and team sessions.
Get the free templateWant to put these ideas into practice?
Whether you're navigating a merger, rethinking how you're structured, or trying to shift a culture that isn't working - start with a conversation.