Service blueprints
A service blueprint is a detailed map of how a service actually works - what the user sees and experiences on the front end, and everything happening behind the scenes to make it possible. It helps organisations redesign services by showing the full picture.
Get the free template
A service blueprint shows you how a service really works - not just what people experience on the surface, but everything happening behind the scenes to make it possible. It's one of the clearest ways to see the full picture of service delivery, from the first moment someone interacts with your organisation through to the systems and processes that support them.
What is a service blueprint?
A service blueprint is a visual map that lays out an entire service across multiple layers. The top layers show what's visible to the person using the service. The bottom layers reveal everything happening out of sight - the coordination, preparation, and infrastructure that makes the experience work.
The format was first introduced in 1984 by G. Lynn Shostack in the Harvard Business Review. Shostack argued that services couldn't be designed the way products were, because so much of a service is invisible. A blueprint makes the invisible visible.
What makes a service blueprint different from a process map is the perspective. A process map shows how work flows through a system. A service blueprint shows how that work connects to the experience of the person being served. It asks: what does this look like from the outside, and what needs to happen on the inside for that to work?
That dual view is what makes it useful. Teams often have a strong understanding of their own part of a service but a limited view of how it fits together. A service blueprint lays the whole thing out in one place, so everyone can see where the joins are - and where they might be causing friction.
How a service blueprint works
The easiest way to think about a service blueprint is as a theatre production. The audience sees the performance on stage - the actors, the set, the lighting. But behind the curtain there are stage managers coordinating cues, a props team preparing for each scene, and a whole production office handling logistics, budgets, and scheduling. A service blueprint maps all of these layers at once, so you can see how the behind-the-scenes work connects to what the audience experiences.
The blueprint reads left to right, following a journey over time. But unlike a simple journey map, it has multiple horizontal layers - called swimlanes - that show different depths of the same experience. Three horizontal lines separate these layers, marking important boundaries in how the service operates.
Here's how the layers work, from top to bottom.
Layer | What it captures |
|---|---|
Physical evidence | The tangible things people encounter - website, emails, printed guides, signage, the room itself. Shapes how a service feels before anyone speaks. |
User actions | Everything the person does moving through - searching, filling in forms, attending, signing, giving feedback. The building blocks of their experience. |
Touchpoints | Every point of contact - a call, an automated email, a session, an app notification. Where the relationship is built or eroded. |
Frontstage actions | The on-stage performance: everything your team does that the person can see - greeting, running a session, explaining options, following up. |
Backstage actions | Everything behind the curtain: preparing, researching, coordinating across departments, updating records. What makes frontstage look seamless. |
Support processes | The infrastructure that makes it all possible - HR, IT, finance, governance, training. Not tied to one user, but everything suffers when it fails. |
Physical evidence

These are the tangible things people encounter during the service - the website, a welcome email, a printed guide, signage in a building, or the layout of a meeting room. Physical evidence shapes how people feel about a service before they've spoken to anyone. A clear, well-designed application form tells a different story from a cluttered one.
When mapping this layer, be specific. "Paperwork" doesn't help. "Application form (PDF, 4 pages)" or "appointment confirmation email with map link" gives the team something to work with.
User actions
Everything the person using the service does as they move through it. Searching online, filling in a form, attending a meeting, signing an agreement, providing feedback. These are the building blocks of their experience, and each one is a moment where things either flow smoothly or create a barrier.
Focus on what you'd see if you were watching someone go through the service. Include both digital actions (clicking, uploading, submitting) and physical ones (arriving, waiting, asking a question). Note where people have to wait or repeat themselves - those are often the friction points.
Touchpoints
Every point of contact between the person and the organisation. A phone call with a team member, an automated email, a face-to-face session, a notification from an app. Touchpoints are where the relationship is built or eroded, and mapping them often reveals gaps - moments where someone is left without contact when they could use reassurance, or overwhelmed with communications when they need space.
Line of user interaction - This line sits between touchpoints and frontstage actions. It marks the boundary between what people do themselves and what your team does for them. Crossing it represents moments where responsibility shifts. When someone submits a form, responsibility moves to your team to process it. When your team suggests options and the person chooses, control shifts back.
Frontstage actions

This is the on-stage performance - everything your team does that the person can see or directly experience. Greeting someone, running a session, explaining options, making a call on their behalf while they're present, sending a follow-up email. Like actors on stage, frontstage staff are shaping the audience's experience in real time, and the quality of that experience depends on preparation that happened long before the curtain went up.
The distinction between frontstage and backstage matters because it affects what skills people need. Frontstage work requires interpersonal confidence and emotional intelligence. Someone might be brilliant at the backstage analysis but struggle with the face-to-face delivery - or the other way round. Knowing which roles are on stage and which are behind the curtain helps you put people where they do their best work.
Line of visibility - This is the curtain line - the most important boundary in the blueprint. Everything above it is visible to the person using the service. Everything below it happens out of sight. Moving activities across this line changes the experience. Making backstage preparation visible can build trust - when people see the research and coordination happening on their behalf, they understand the value. But sometimes keeping complexity hidden is kinder, so people aren't overwhelmed by the production machinery.
Backstage actions

This is everything happening behind the curtain. Preparing for meetings, researching options, coordinating with other departments, updating records, debriefing after difficult conversations. Just as a stage manager ensures the right props are in the right place before each scene, backstage work is what makes frontstage delivery look seamless. When backstage processes are under-resourced or poorly designed, the performance suffers - and the audience notices, even if they can't pinpoint why.
A common finding when blueprinting is that backstage work is invisible not just to service users, but to other parts of the organisation. The effort it takes to prepare for a client session, for example, is often underestimated by people who only see the session itself.
Line of internal interaction - This separates work that directly supports individual service delivery (backstage) from work that supports the organisation as a whole (support processes). Activities below this line often happen on different timescales and involve different people entirely.
Support processes

If frontstage is the performance and backstage is the stage management, support processes are the production company - the organisational infrastructure that makes everything else possible. HR and recruitment, IT systems, financial management, governance, training, partnerships, strategic planning. These processes don't relate to any individual service user, but when they fail, everything above them suffers.
A useful question for this layer: what needs to be in place organisationally for the service to function? If recruitment is slow, frontstage capacity drops. If the IT system crashes, backstage coordination falls apart. The support layer reveals these dependencies.
How to use a service blueprint
Service blueprinting works best as a collaborative exercise. The people who deliver different parts of the service will see things that no single person could map alone.
Choose one journey. Don't try to blueprint your entire organisation. Pick a specific service or a specific type of journey - a new client's first three months, or the process from referral to first session. Tightly scoped blueprints are more useful than sprawling ones.
Assemble the right people. You need perspectives from every layer. Someone who knows the user experience. Someone who delivers the frontstage work. Someone who handles backstage coordination. Someone who understands the support systems. If one layer is missing from the room, it'll be missing from the blueprint.
Map what actually happens, not what should happen. This is where blueprints get interesting. The gap between the designed process and the actual process is usually where the problems live. If a step gets skipped in practice, or if people have created workarounds, that's valuable information.
Look for the patterns. Once the blueprint is mapped, step back and look for:
- Failure points - where does the service most often break down?
- Wait points - where are people left waiting, and what's causing the delay?
- Handoff points - where does responsibility move between people or teams? Handoffs are where information gets lost
- Redundancies - is the same information being collected more than once? Is the same work being done in two places?
Use it as a living document. A blueprint isn't a one-off. Update it when processes change, when you redesign part of the service, or when you want to test what a proposed change would look like before implementing it. Some teams revisit their blueprint quarterly as part of service improvement work.
Pairing with other tools
A service blueprint pairs well with an empathy map to capture what people are thinking and feeling at each stage - the emotional layer that the blueprint's structure doesn't show. Contextual inquiry can feed the mapping process, helping you observe what actually happens rather than relying on what people remember. And if a specific touchpoint needs deeper investigation, audience personas can help you understand how different groups experience the same journey differently.
Example
A regional housing provider wants to improve its repairs service after receiving consistent complaints about communication. The team assembles staff from customer contact, scheduling, the repairs team, and IT to map the journey from a tenant reporting a fault to the repair being completed.
Physical evidence: Online portal, automated acknowledgement email, appointment confirmation text, access instructions for the tenant, completion certificate.
User actions: Tenant reports fault online, selects available appointment slots, confirms access arrangements, is present for the repair, receives completion notification.
Touchpoints: Portal submission confirmation, appointment reminder text (2 days before), phone call from the repairs team if access is needed, follow-up satisfaction survey.
Frontstage: Customer contact team logs the fault and books the appointment. Repairs operative arrives, explains the work, completes the repair, confirms with the tenant.
Backstage: Scheduling system assigns the job based on skill type and location. Parts are checked against stock. If specialist parts are needed, procurement is triggered. The operative reviews the job notes before attending.
Support processes: Fleet management, procurement contracts with suppliers, workforce training and development, the CRM system, compliance with regulatory inspection standards.
The blueprint reveals something the complaints data didn't: the biggest friction point isn't the repair itself - it's the gap between acknowledgement and appointment. Tenants report a fault, get an instant automated email, then hear nothing for days while backstage scheduling and parts-checking happens. The fix isn't a process change - it's a communication change. Adding a progress update at the backstage-to-frontstage handoff ("Your repair has been scheduled for Thursday, your operative is Sarah") closes the gap that was generating most of the complaints.
Limitations of service blueprints
They show structure, not emotion. A blueprint maps what happens and where, but it doesn't capture how people feel about it. Two touchpoints might look identical on the blueprint, but one might be reassuring and the other anxiety-inducing. Pair with qualitative research or an empathy map to capture the emotional layer.
They're a snapshot. A blueprint shows a service at a point in time. Services evolve, workarounds emerge, staff change, systems update. A blueprint that isn't maintained becomes a historical document rather than a working tool.
Complexity grows quickly. A simple service might have 6-8 touchpoints. A complex one might have 30+. At a certain scale, the blueprint becomes unwieldy and needs breaking into sub-journeys or phases. Know when to scope down rather than trying to fit everything onto one map.
They need the right people in the room. A blueprint built by one person - or by a team that only knows one layer - will have blind spots. The value comes from cross-functional mapping, and that requires coordination and time.
Getting started
Start with a single, well-defined journey. Pick something your team knows is causing friction, or a service you're about to redesign. Get four or five people together who each see a different part of the service, give yourselves a couple of hours, and map what actually happens - not what's written in the process document.
Use a whiteboard, sticky notes, or a digital tool like Miro. Draw the swimlanes first (physical evidence, user actions, touchpoints, frontstage, backstage, support processes), add the three lines of interaction, and then fill in each layer from left to right, following the journey as it unfolds.
The first blueprint won't be perfect, and that's fine. The real value isn't the finished diagram - it's the conversation. The moment someone says "wait, that's not how it actually works" or "I didn't know that step existed" is when the blueprint starts earning its keep. What your team sees when they step back and look at the full picture is almost always different from what any individual assumed.
We regularly share thinking on organisational change and development on LinkedIn - ideas, practical approaches, and useful tools for people working on making their organisations better.
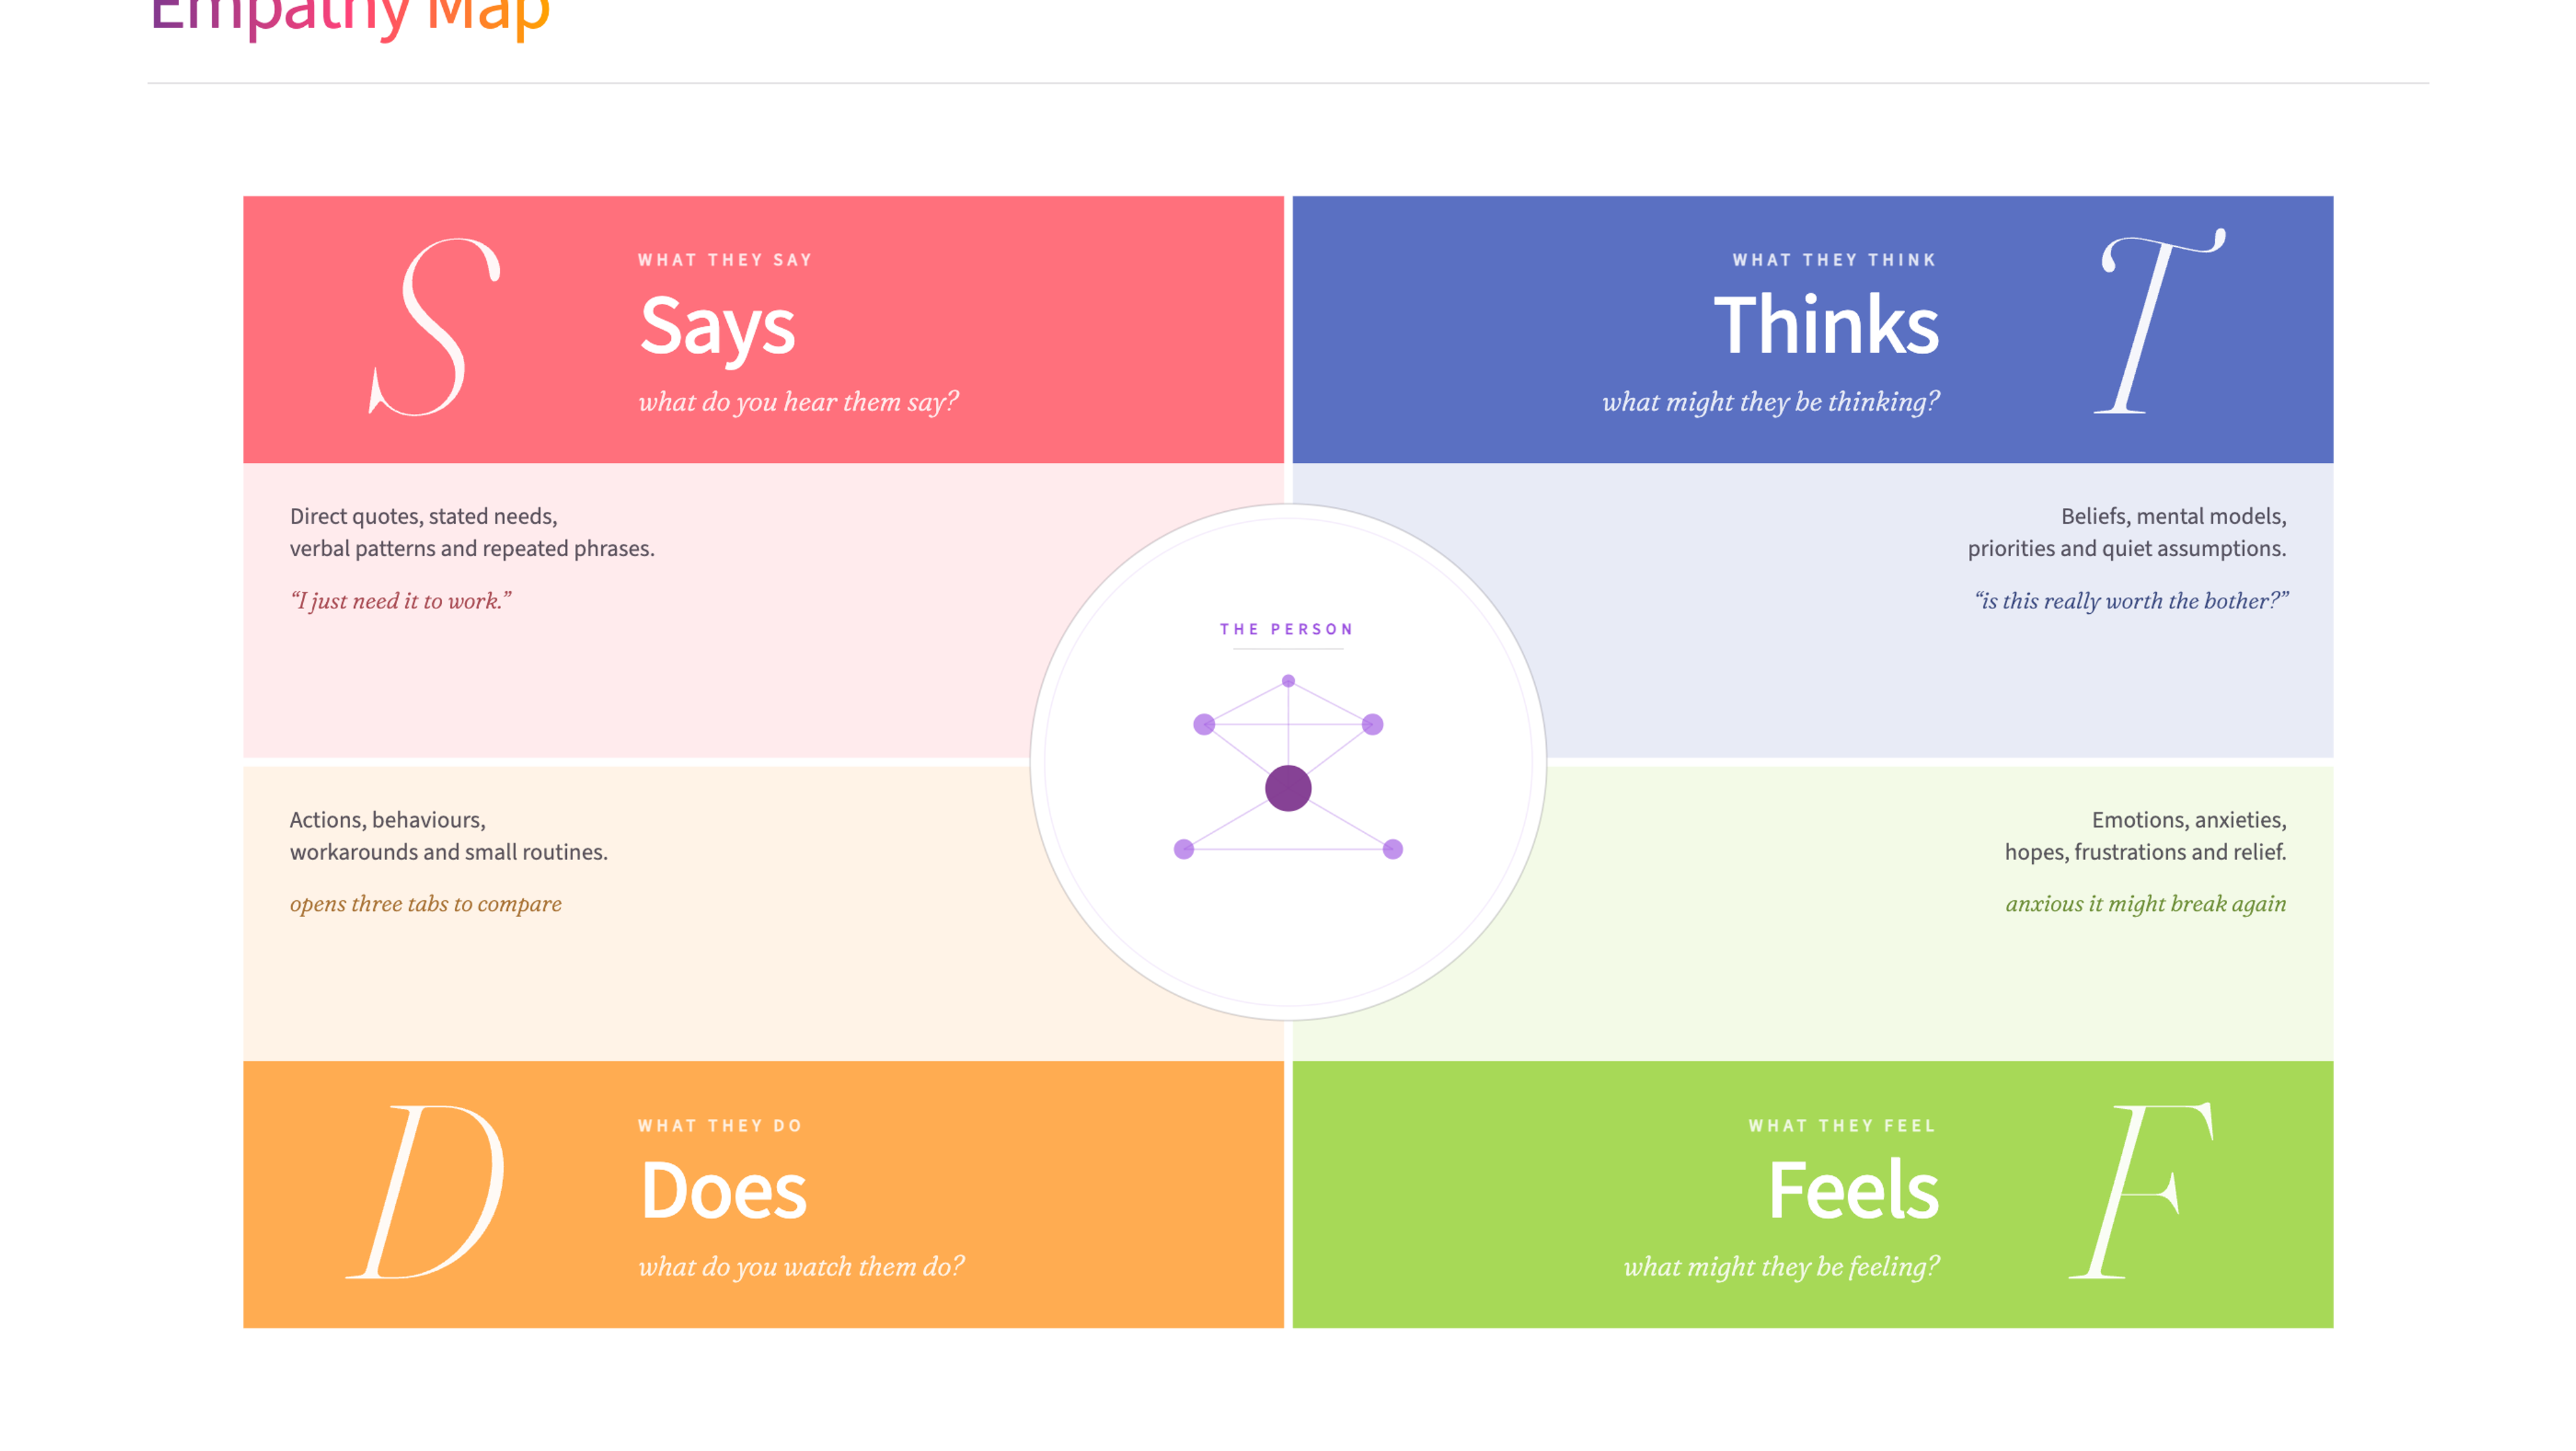
An empathy map is a collaborative visualisation tool that captures what we know about a user's behaviours, thoughts, feelings, and motivations, helping teams develop deeper understanding and more human-centred solutions.
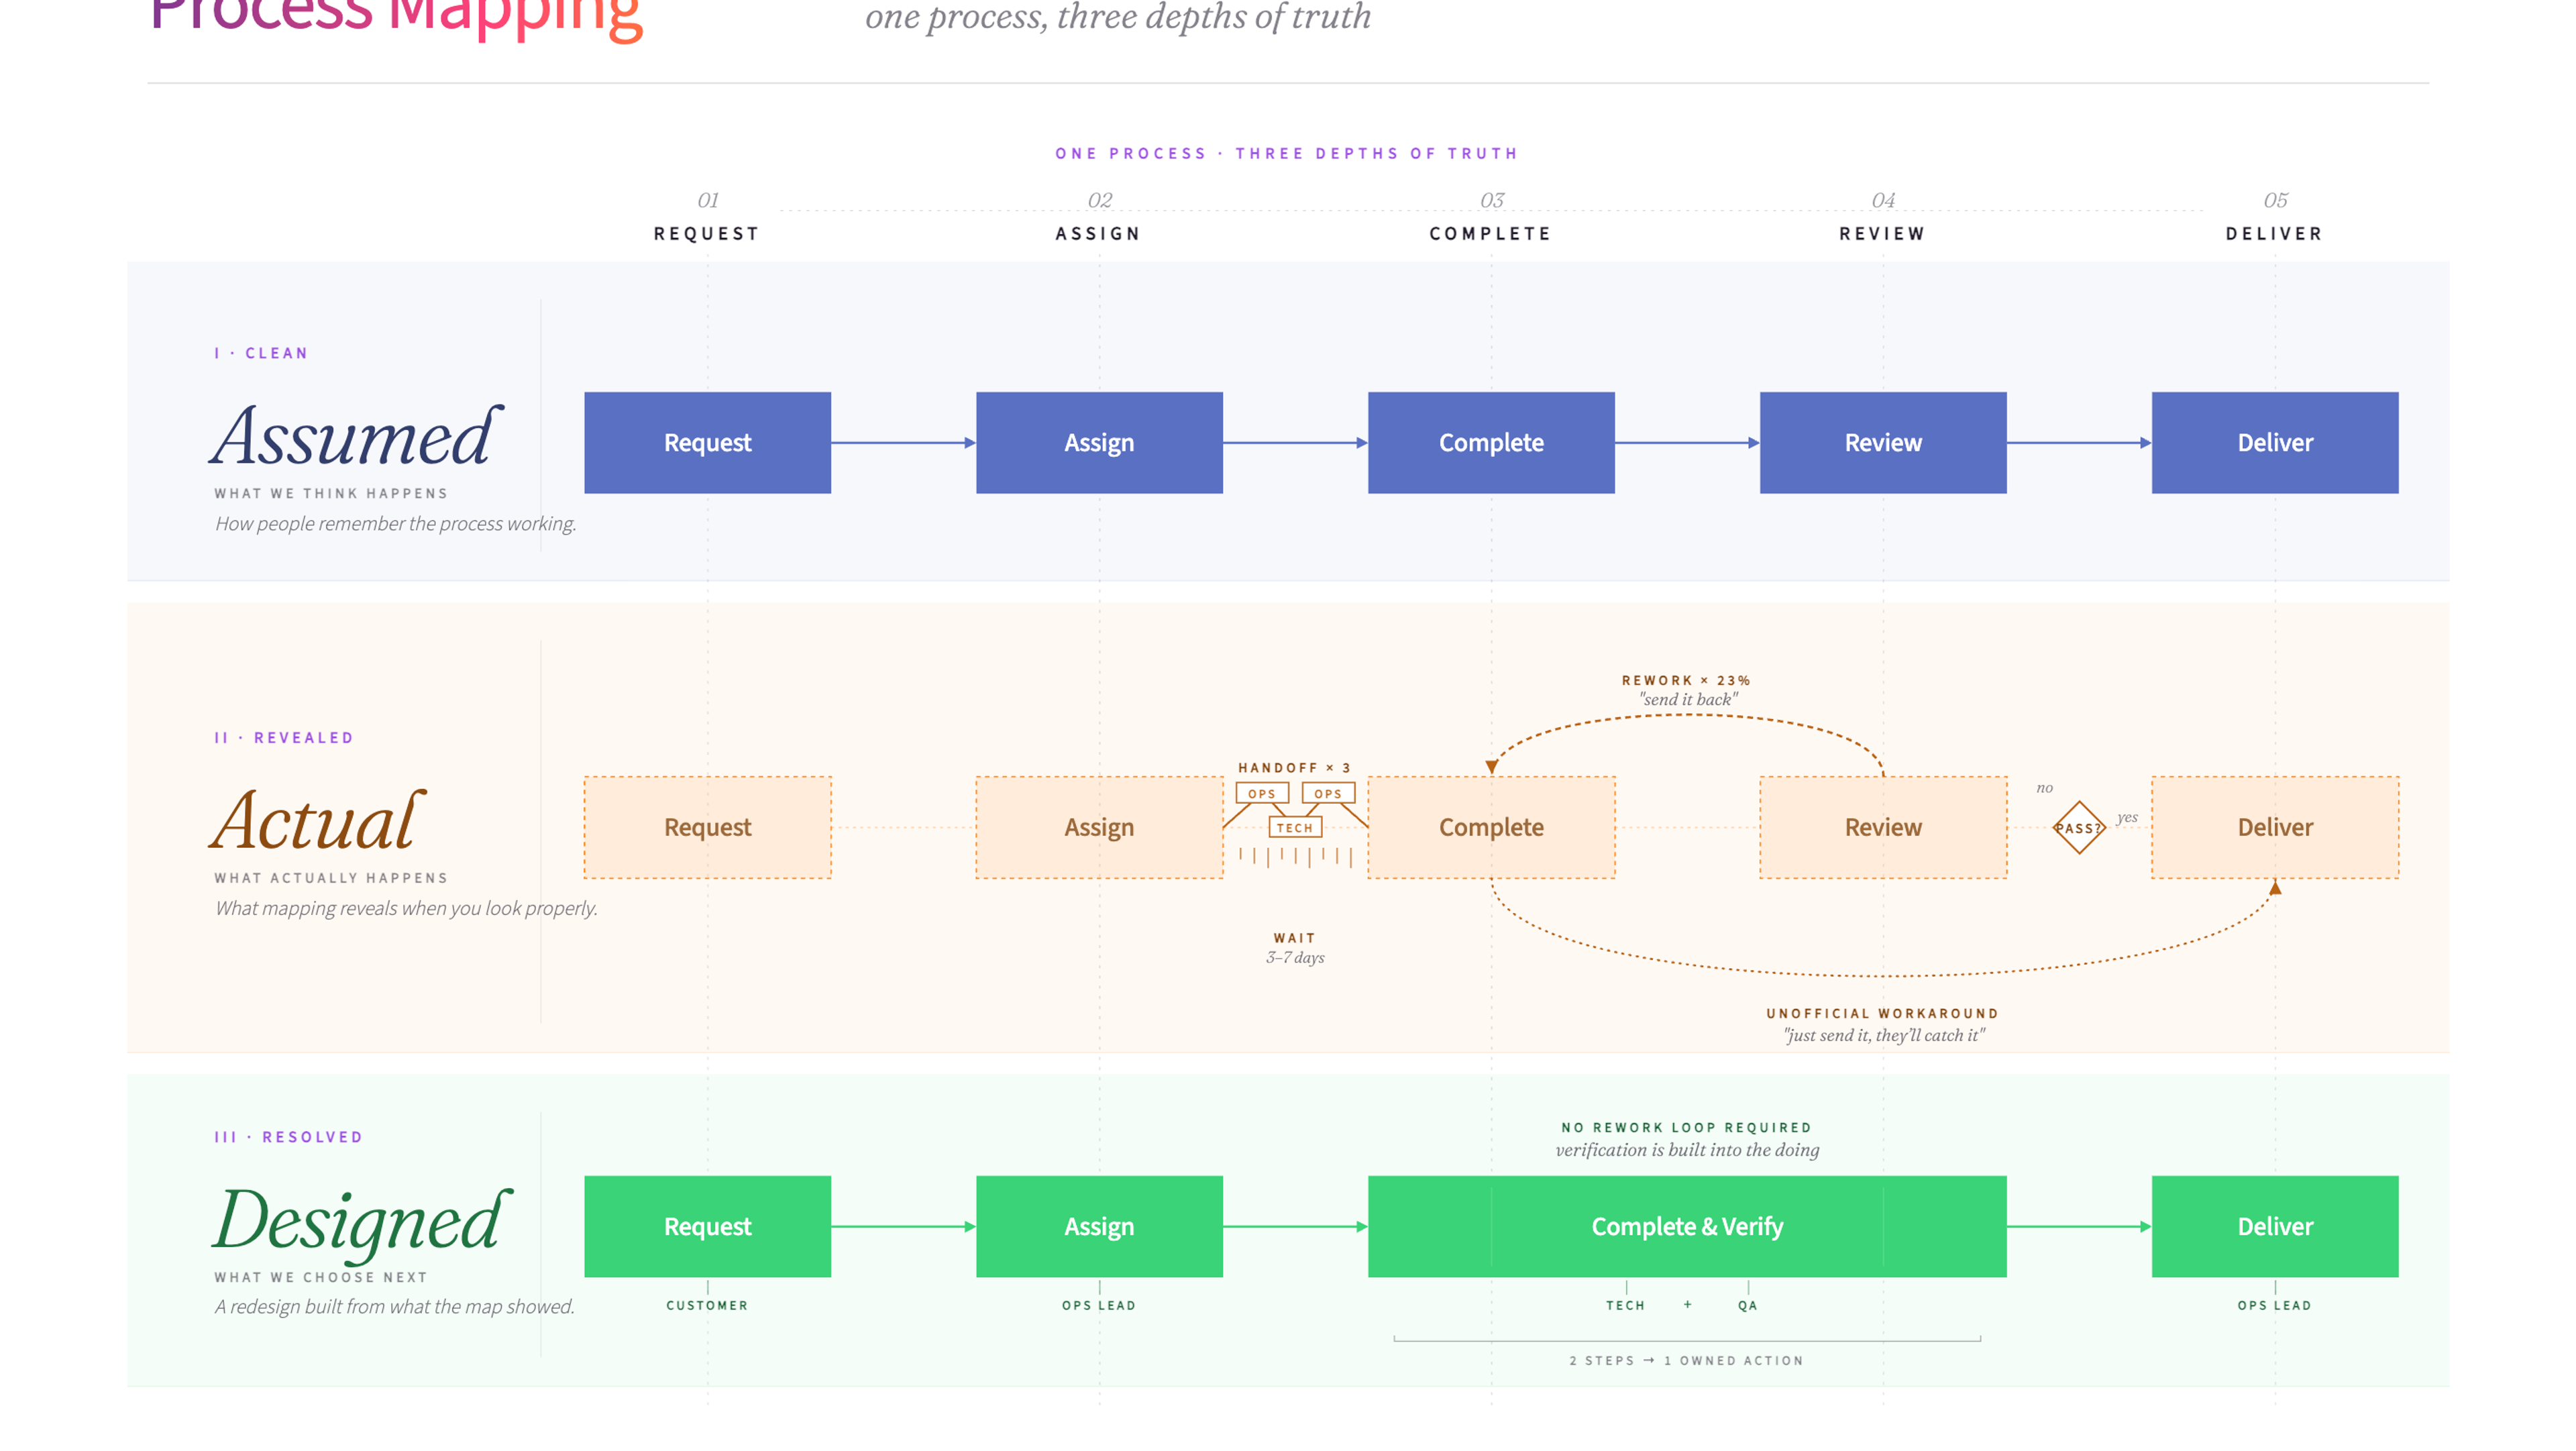
Process mapping is a visual method for documenting how a process works from start to finish. It helps teams see the full picture - every step, decision point, and handoff - so they can spot problems and design improvements.
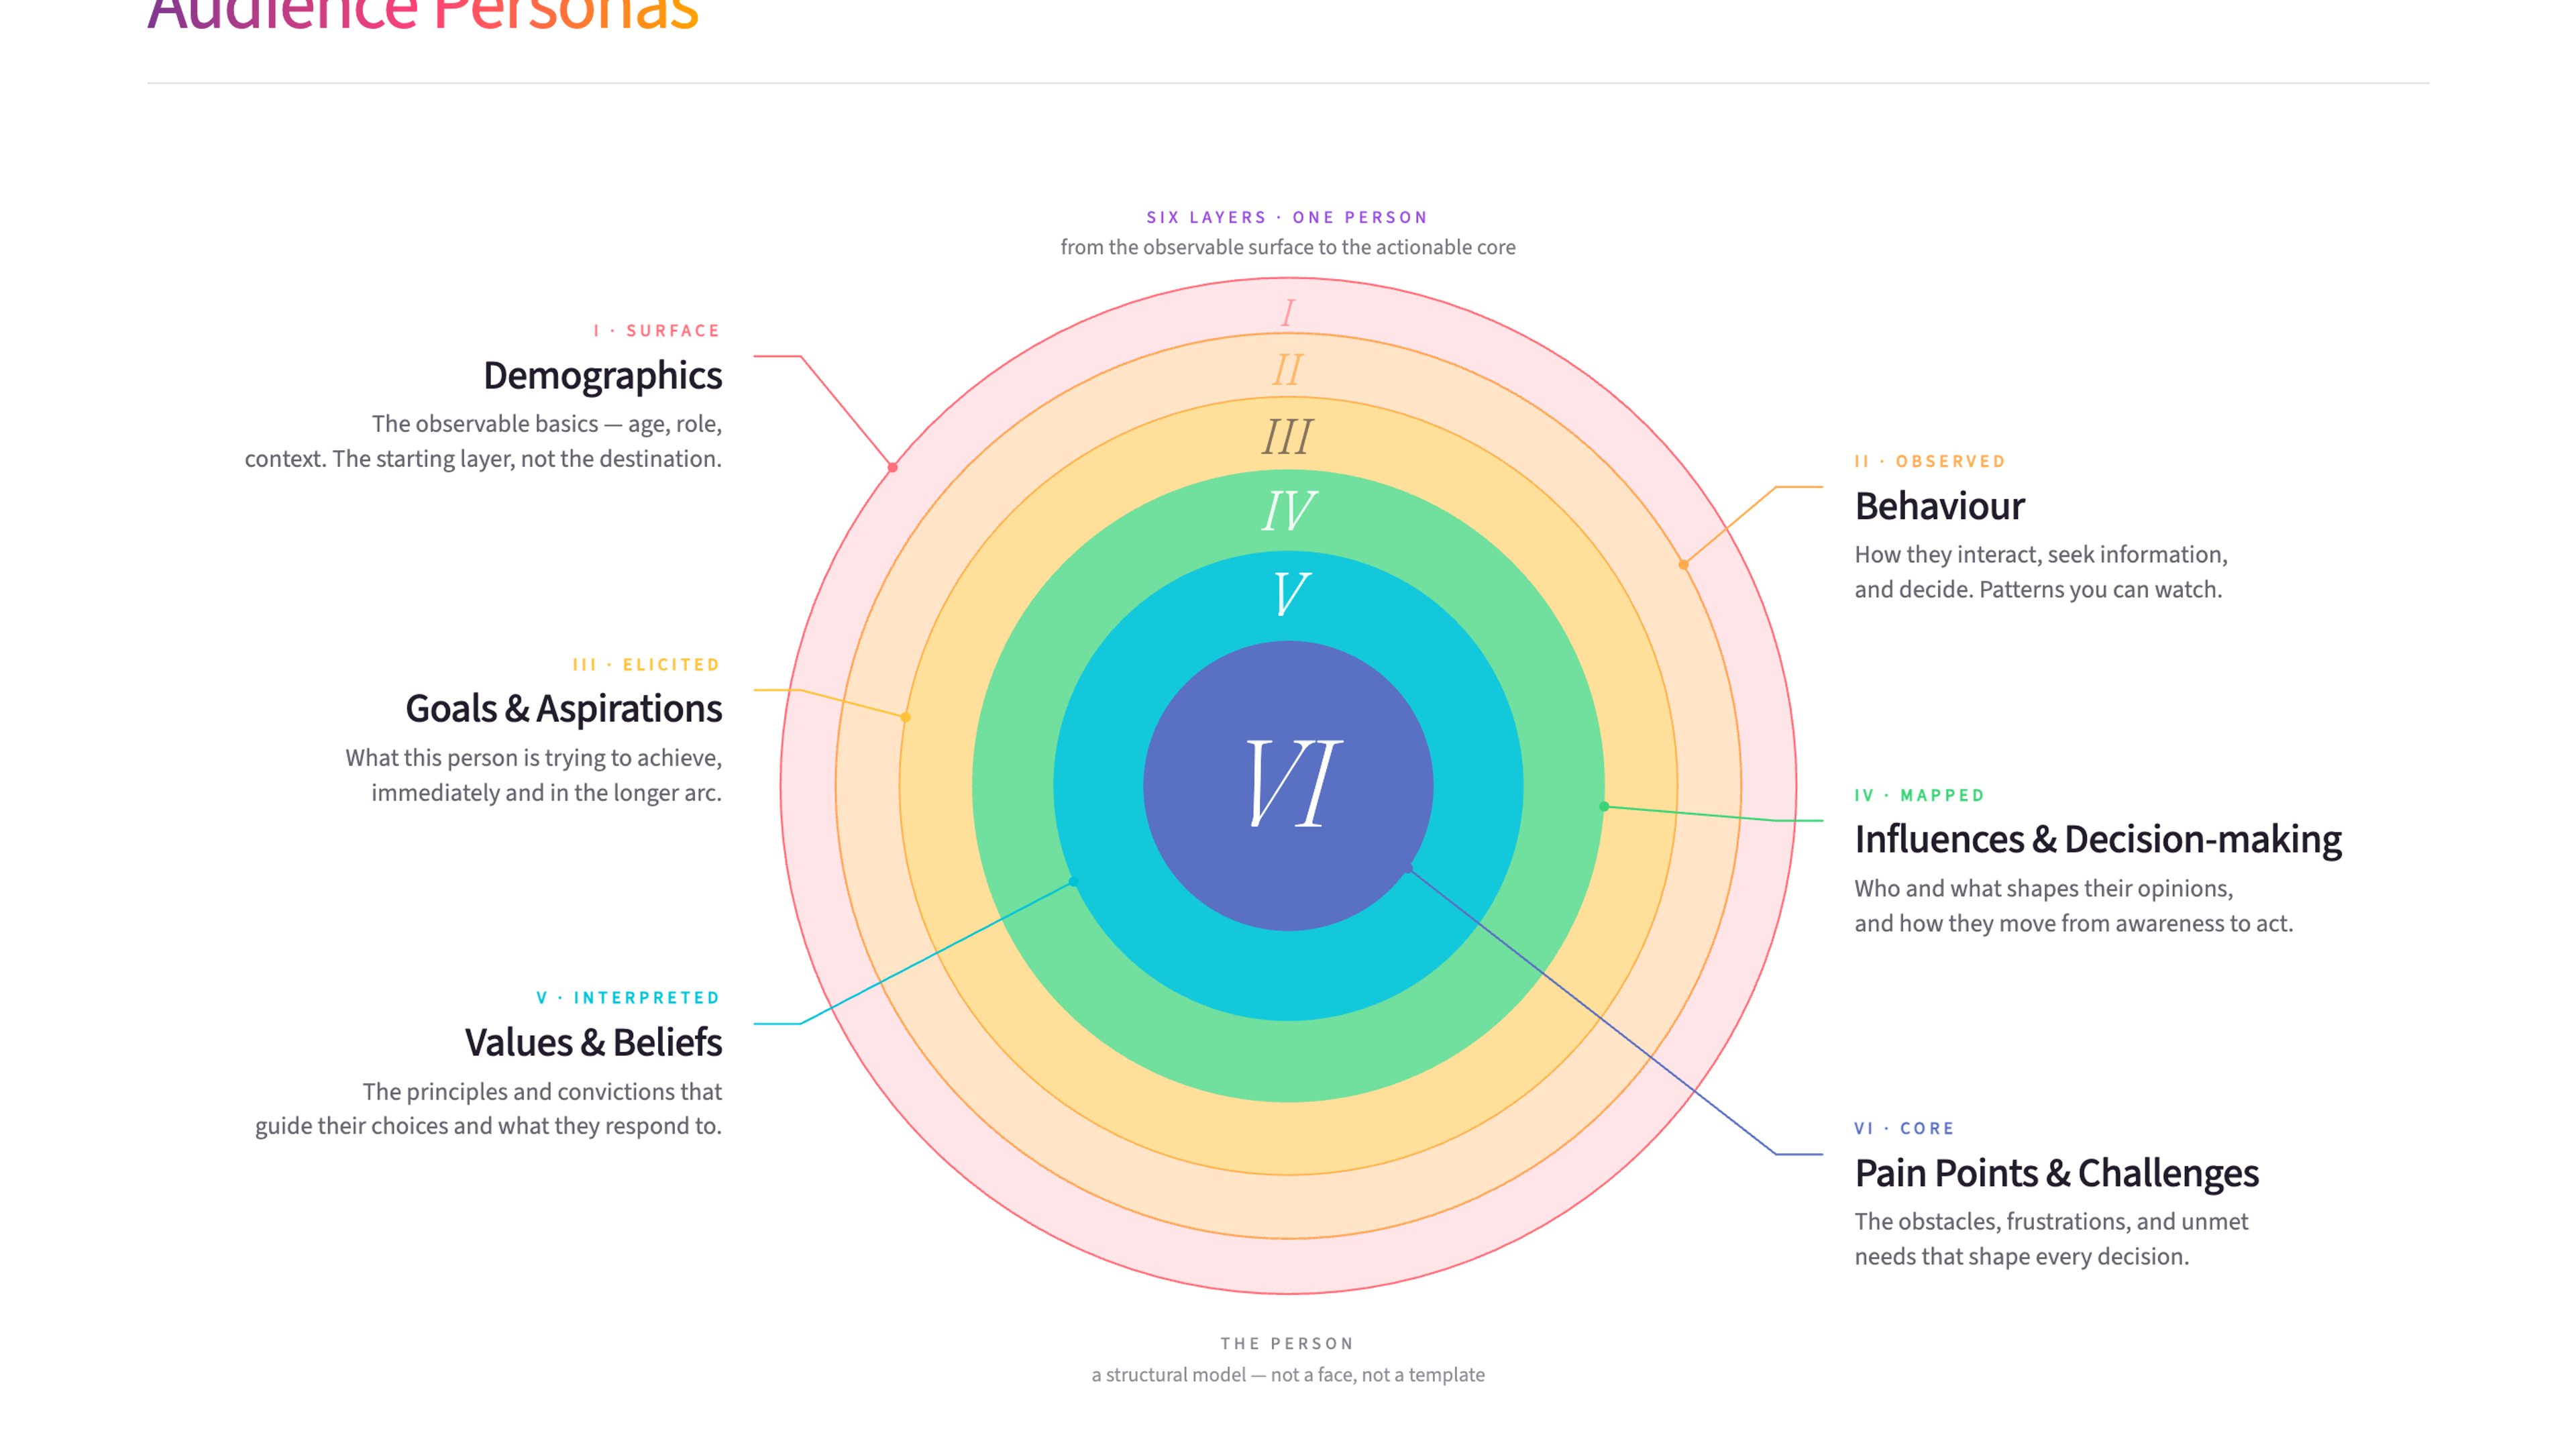
Audience personas are detailed profiles of the people you're trying to reach, built from real research into their needs, behaviours, and motivations. They help organisations design services and communications that actually resonate with the people who matter most.
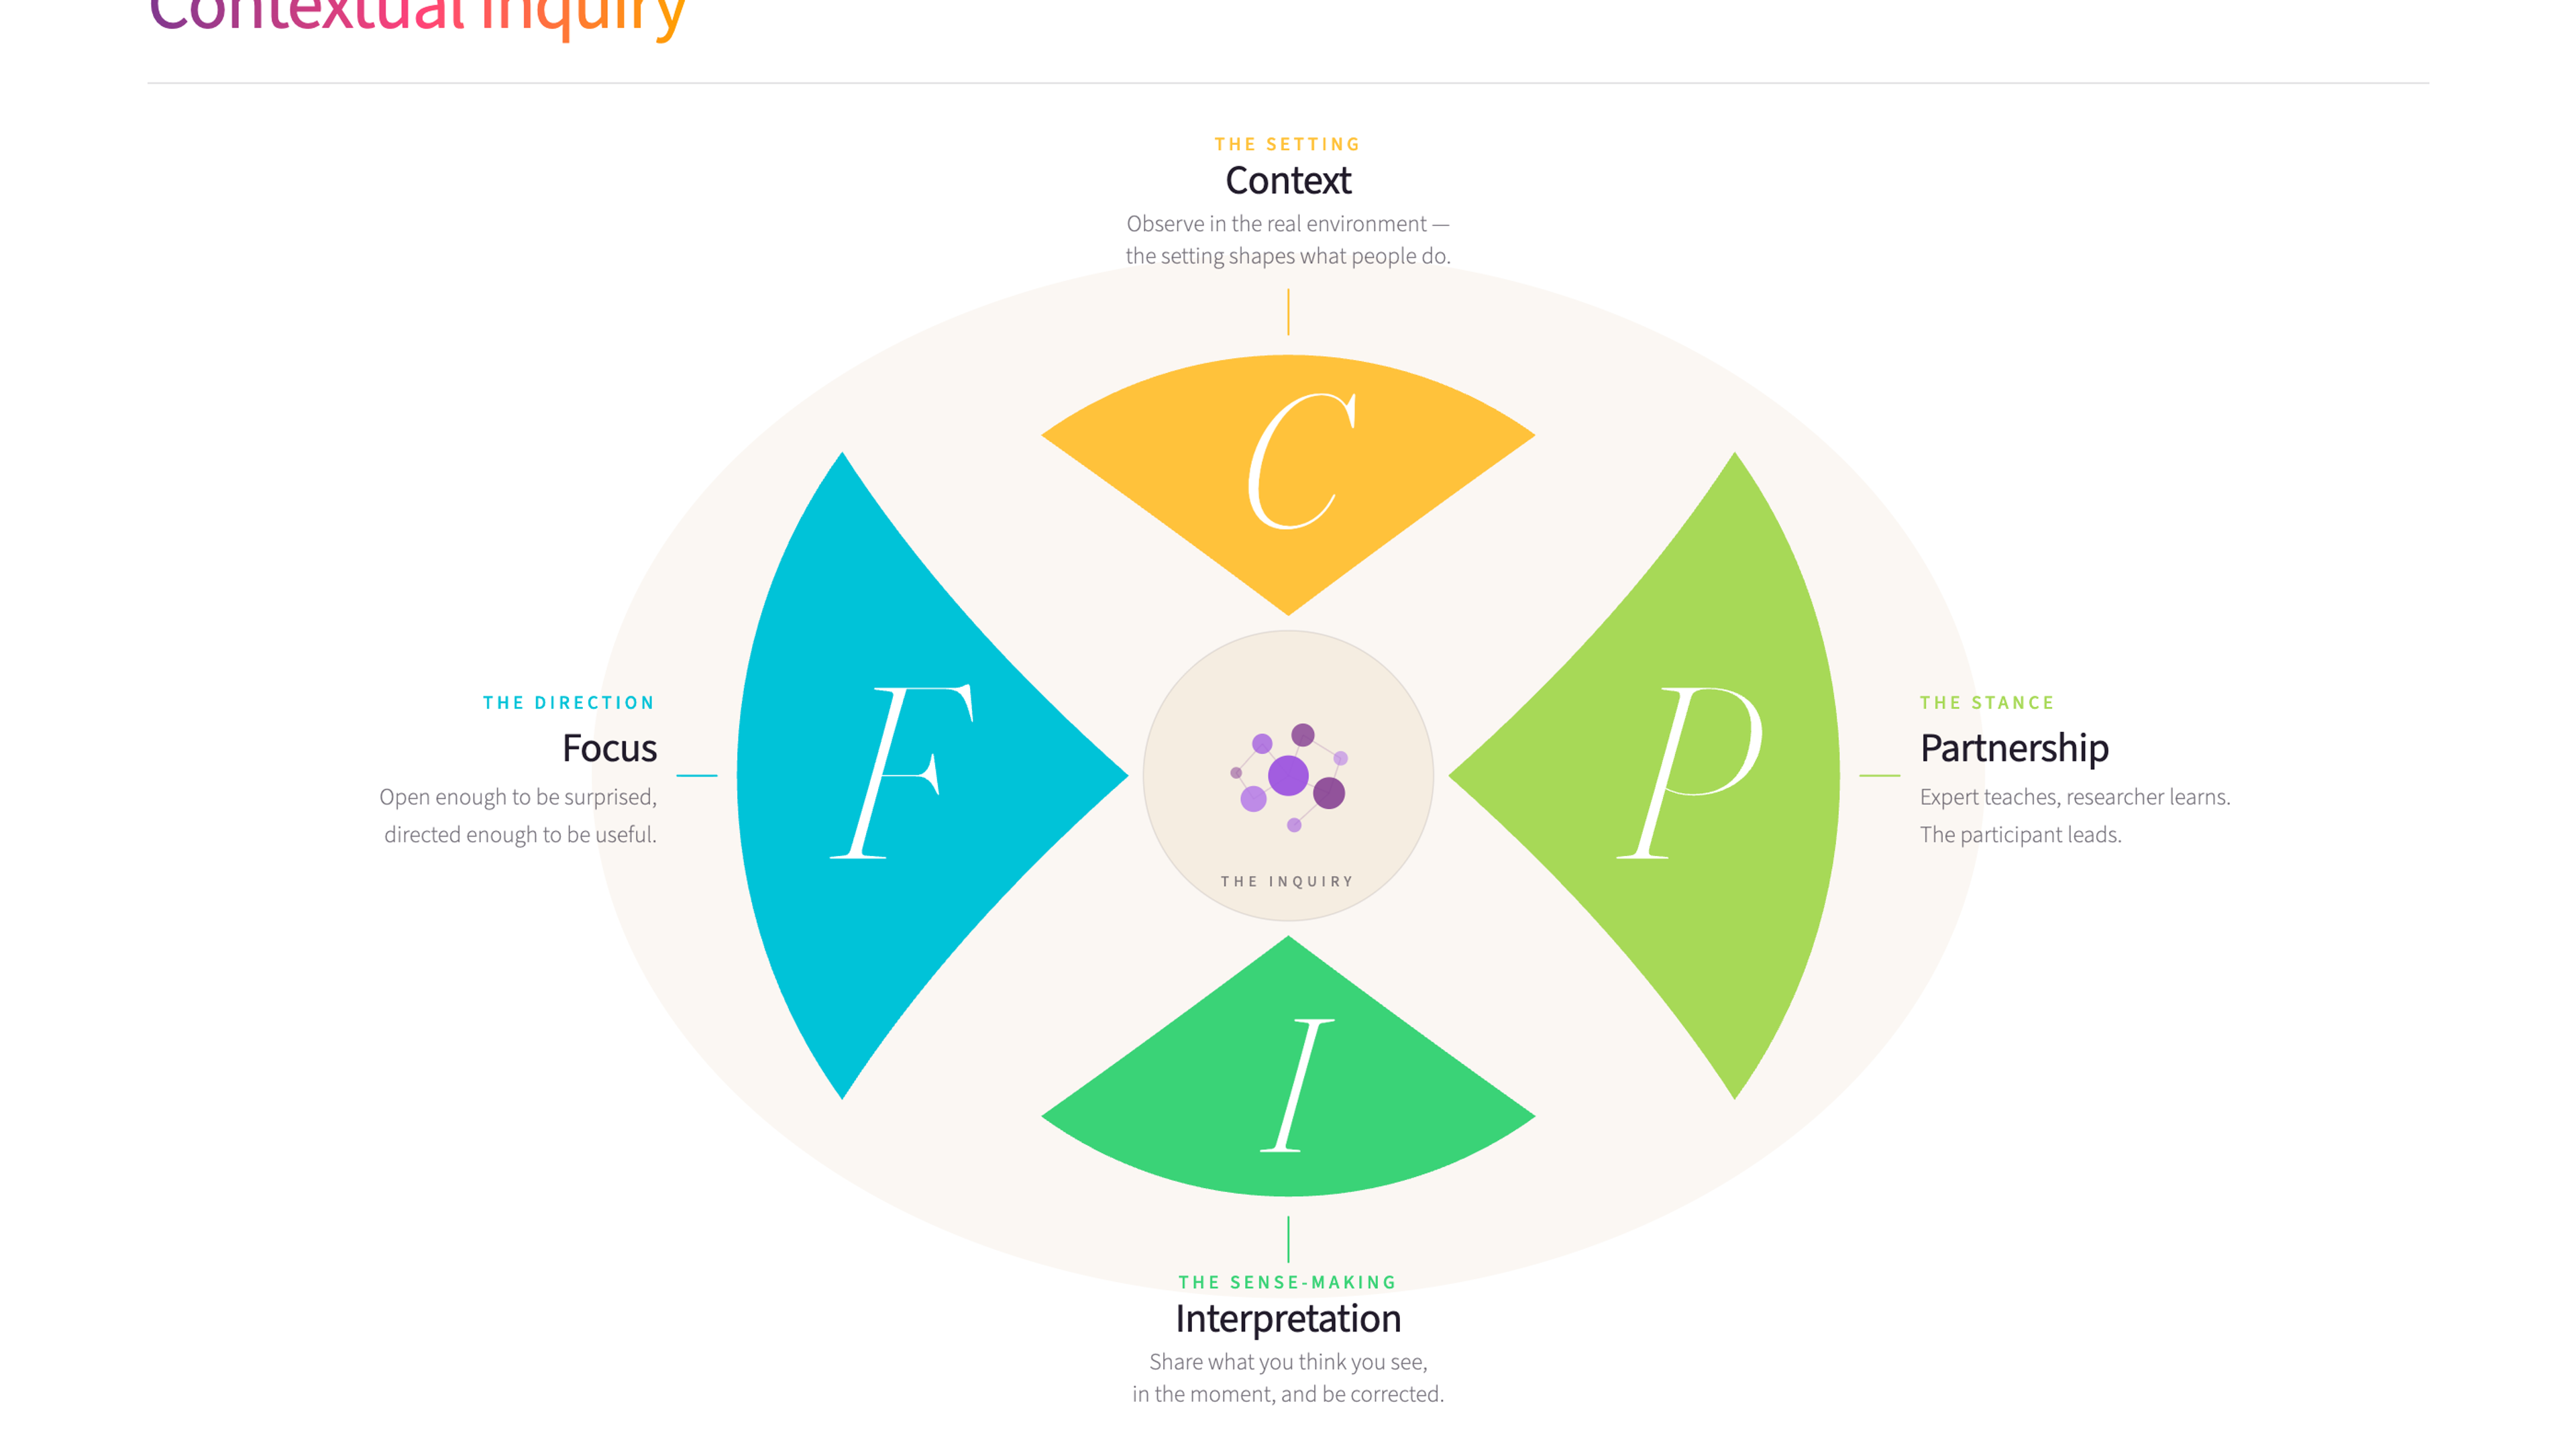
Contextual inquiry is a user research method where you observe and interview people in their actual work environment while they perform real tasks. It uncovers insights about real behaviour and needs that surveys and interviews in meeting rooms simply can't reach.
The skills that make someone good at service design - empathy, experience mapping, designing conditions - are the same skills leaders need to create environments where people do their best work. What changes when that lens runs all the way through the organisation.

Every organisation has friction - the unnecessary effort, the needless complexity, the things that make simple work harder than it should be. This article explores how to find it, understand where it comes from, and reduce it without creating new problems in the process.
Customer Experience Training
Service blueprints show how the experience really works behind the scenes, and they are one of the methods we draw on in our Customer Experience training.
James Freeman-Grayis the founder of Mutomorro. He's an organisational development practitioner who has spent over a decade working with leaders across public, private, and nonprofit sectors - helping organisations navigate change, strengthen culture, and design better ways of working.
Service blueprinting is the tool I use when organisations know their service isn't working but can't see why. By mapping both the visible customer experience and the invisible processes behind it, problems that seemed mysterious become obvious. I've seen blueprints reveal that what felt like a "culture problem" was a broken handoff between two teams.
Last reviewed: June 2026
Ready to use Service blueprints?
Download the free template - includes practical guidance for workshops and team sessions.
Get the free templateWant to put these ideas into practice?
Whether you're navigating a merger, rethinking how you're structured, or trying to shift a culture that isn't working - start with a conversation.