Process Mapping
Process mapping is a visual method for documenting how a process works from start to finish. It helps teams see the full picture - every step, decision point, and handoff - so they can spot problems and design improvements.
Get the free template
Process mapping is the practice of making work visible. Most organisations operate with processes that exist in people's heads - assumed, informal, and rarely examined. A process map takes something everyone thinks they understand and puts it on the table where the whole team can see it, question it, and improve it. The result is rarely what anyone expected.
What is process mapping?
Process mapping is a way of documenting how work flows through an organisation - every step, decision, handoff, and delay - using a visual diagram. The original idea dates back to Frank and Lillian Gilbreth, who introduced the first formal process charts in the 1920s as a way to study and improve industrial workflows. A century later, the same core principle applies: if you can see the work, you can improve it.
What makes process mapping more than a drawing exercise is what it reveals. Research from BPTrends found that only 15% of organisations say their processes are usually documented and kept up to date. Just 12% say their managers are trained to analyse, design, and manage processes. And a separate study found that of the 69% of firms with established procedures, only 4% were monitoring and controlling them.
That gap - between what organisations assume about their processes and what's happening in practice - is where process mapping does its most important work. It's less about creating a diagram and more about having the conversation that creates it.
How process mapping works
The diagram above shows the same five-step process - Request, Assign, Complete, Review, Deliver - at three depths of truth. This is how process mapping works in practice: you start with what people believe happens, reveal what's really going on, and then design something better from what you've learned.
Flow | What it is | What it captures |
|---|---|---|
The assumed flow | The clean, linear version people carry in their heads | The intended sequence - but none of the delays, workarounds, or informal decisions |
The actual flow | What mapping reveals when the team looks properly | The hidden handoffs, waits, rework loops, and workarounds that have built up over time |
The designed flow | A deliberate redesign built from what you found | Informed simplicity - clean because you've examined the complexity and chosen how to handle it |
The assumed flow

Every process has an assumed version - the clean, linear sequence that people carry in their heads. Request comes in, someone assigns it, it gets completed, reviewed, and delivered. Five steps, neat arrows, no complications.
This is how most people would draw their process on a whiteboard from memory. It's also how most internal documentation describes work, if documentation exists at all. The assumed flow isn't wrong - it captures the intended sequence. But it misses everything that happens between the boxes: the delays, the workarounds, the informal decisions that nobody put in the original design.
The assumed flow is your starting point, not your answer. Process mapping begins here because it establishes the shared picture - what the team believes the process looks like before anyone starts examining it closely.
The actual flow

This is what mapping reveals when you look properly. The same five steps are still there, but now you can see what's been invisible.
Between Assign and Complete, there's a handoff that bounces between three people and a wait of three to seven days that nobody designed into the process - it just emerged. Between Complete and Review, there's a rework loop: roughly a quarter of items get sent back, adding time and friction. And there's an unofficial workaround where some items skip review entirely because the team has learned that waiting creates bigger problems than the occasional missed error.
None of this appears in the assumed flow. Not because anyone is hiding it, but because these patterns build up gradually and become part of how the work just is. The team works around them every day without thinking of them as problems to solve.
This is the step that changes things. When a team maps the actual flow together - walking through real examples, asking "what happens next?" and "what happens when this goes wrong?" - they surface knowledge that has never been shared. The person doing the assigning knows about the handoff problem. The reviewers know about the rework rate. The delivery team knows about the workaround. But until the map puts all of this in one place, nobody sees the full picture.
As practitioners often observe: the map itself is useful, but the conversation people have while creating it is where the real value lies.
The designed flow

The designed flow is not a return to the assumed version. That was uninformed simplicity - clean because it didn't know any better. The designed flow is informed simplicity: clean because you've examined the complexity and made deliberate choices about how to address it.
In the designed flow, the hidden rework loop becomes a structured feedback channel - a formal path between Review and Complete with clear criteria for when something needs another pass. The wait between Assign and Complete is addressed by clarifying ownership: each step has a named role (Customer, Ops Lead, Tech and QA, Review Panel, Ops Lead) rather than vague shared responsibility. The unofficial workaround is either formalised - if it turns out to be a sensible shortcut - or eliminated, now that the bottleneck it was bypassing has been fixed.
This is where process mapping connects to wider improvement work. Once you have a clear picture of both the current state and the desired state, you can use tools like the 5 Whys to investigate root causes, the 8 Wastes of Lean to categorise what you've found, and approaches like the Kaizen Cycle or PDCA to make iterative improvements. The map gives you the territory. Other tools help you navigate it.
How to use process mapping
Choose a process that matters. Don't start with the most complex process in the organisation. Pick something contained but important - a process your team runs regularly where you suspect there's friction, delay, or confusion. Onboarding a new team member, handling a customer request, or getting a decision approved are all good candidates.
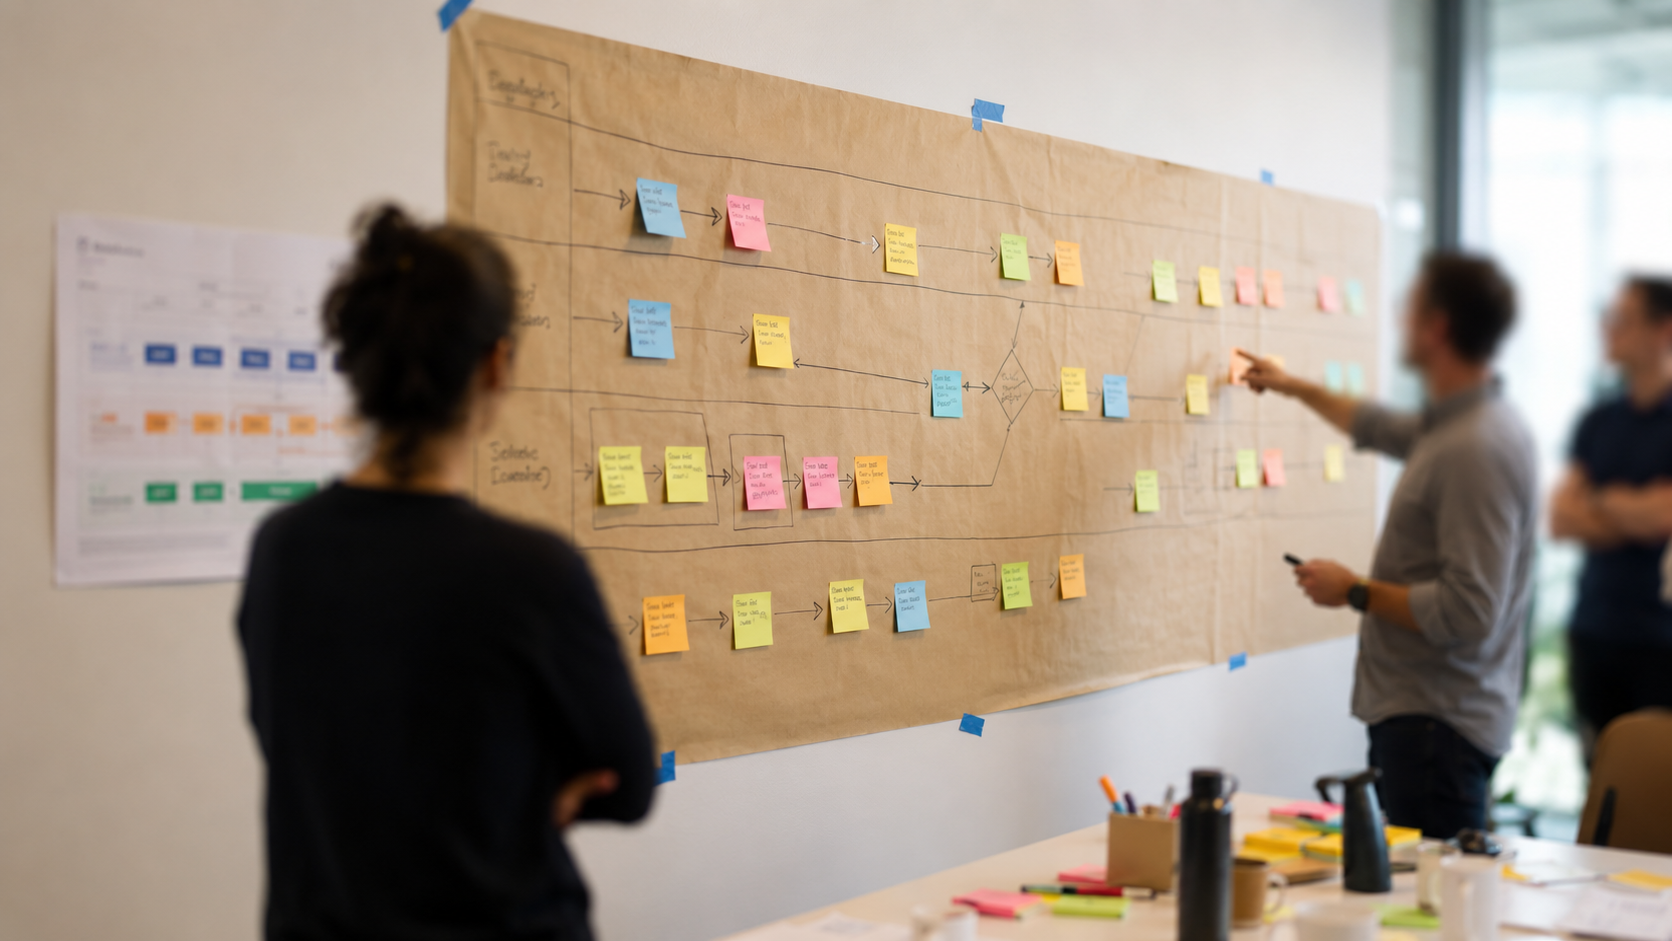
Map the assumed flow first. Gather the people involved and ask them to describe the process as they understand it. Draw it out together - sticky notes on a wall, a whiteboard, or a digital tool. Don't correct anyone yet. You're capturing what the team believes happens, and that shared picture is valuable even if it's incomplete.
Walk the actual flow. Now go deeper. Work through real recent examples: "What happened last time we did this?" Ask about exceptions, workarounds, delays, and handoffs. Who touches the work? Where does it sit waiting? What happens when something goes wrong? This is where the revealing happens. Expect surprises - the gap between what people assume and what's real is often wider than anyone expected.
Design the improved flow. With both the assumed and actual flows visible, the team can now make informed choices. Where are the bottlenecks? Which handoffs create delays? Are there workarounds that should be formalised or steps that should be removed? Design the process you want, then test it. A process map is a living document - revisit it regularly as the work evolves.
Agree on ownership. One of the most common findings in process mapping is that nobody owns the process end to end. Individual steps have owners, but the flow between them is unmanaged. The designed flow should name who is responsible for each stage and who owns the process as a whole.
Example
A professional services firm notices that client projects are taking longer to start than they should. The time between a signed contract and the first piece of work being delivered has stretched from two weeks to nearly six, but nobody can point to a single cause.
The delivery team maps the project kickoff process. The assumed flow looks straightforward: contract signed, project assigned to a team, brief created, work begins. Four clean steps.
The actual flow reveals something different. After the contract is signed, it sits in a shared inbox for an average of four days before anyone picks it up. Assignment involves three conversations between two managers who both think the other is responsible for resourcing. The brief requires information from the client that nobody requests until the team is ready to start - creating another wait. And there's an informal "pre-brief" step where the lead consultant reviews the contract terms because they don't trust the summary that gets passed along.
The designed flow addresses each of these. An automatic notification triggers assignment within 24 hours. A single resource owner is named. Client information is requested at contract stage, not project stage. And the pre-brief is formalised into a five-minute contract review that happens as part of assignment rather than as a separate, hidden step.
The result: kickoff time drops from six weeks back to under three. Not through any single dramatic change, but through making the invisible visible and designing around what they found.
Limitations
Process mapping shows you the flow of work, but it doesn't tell you everything.
It captures the process, not the culture. A map can show that a handoff creates delays, but it won't explain why people avoid raising the issue. If there are deeper cultural reasons why problems persist - fear of blame, unclear authority, resistance to changing established ways of working - the map will surface symptoms without fully explaining causes. Tools like the Iceberg Model can help you explore what sits beneath the visible process.
It's a snapshot, not a system. A process map shows how work flows at a point in time. It doesn't automatically capture how the process interacts with other processes, or how a change in one area might affect another. For broader system-level thinking, consider connecting process mapping with approaches like the BPM Lifecycle, which provides a structured way to manage processes over time.
It needs the right people in the room. A process map drawn by managers alone will often look like the assumed flow. The people who know how the work really moves are the ones doing it every day. If they're not part of the mapping exercise, the actual flow stays hidden.
It can create a false sense of completion. A beautifully drawn process map is satisfying, but the map is the beginning of improvement work, not the end. The value comes from what you do with what you've learned - redesigning, testing, and iterating. A map that sits in a drawer is just a diagram.
Getting started
Start with one process. Pick something your team does regularly - something where you've heard people say "it shouldn't take this long" or "I don't know why we do it this way." Block out 90 minutes with the people who touch the work. Map the assumed flow together first (15 minutes), then walk through two or three recent real examples to build the actual flow (45 minutes), then spend the remaining time identifying the three biggest gaps between what you assumed and what you found.
You don't need special software or formal notation to start. Sticky notes on a wall work well. The point isn't the diagram - it's the conversation that creates it.
For teams looking to build process improvement into how they work rather than treating it as a one-off exercise, our operational effectiveness consultancy can help you develop the capability to map, measure, and improve processes across your organisation. The Momentum through Work dimension of the EMERGENT framework explores how organisations can create conditions where work flows naturally rather than fighting friction at every turn.
We regularly share thinking on organisational change and development on LinkedIn - ideas, practical approaches, and useful tools for people working on making their organisations better.
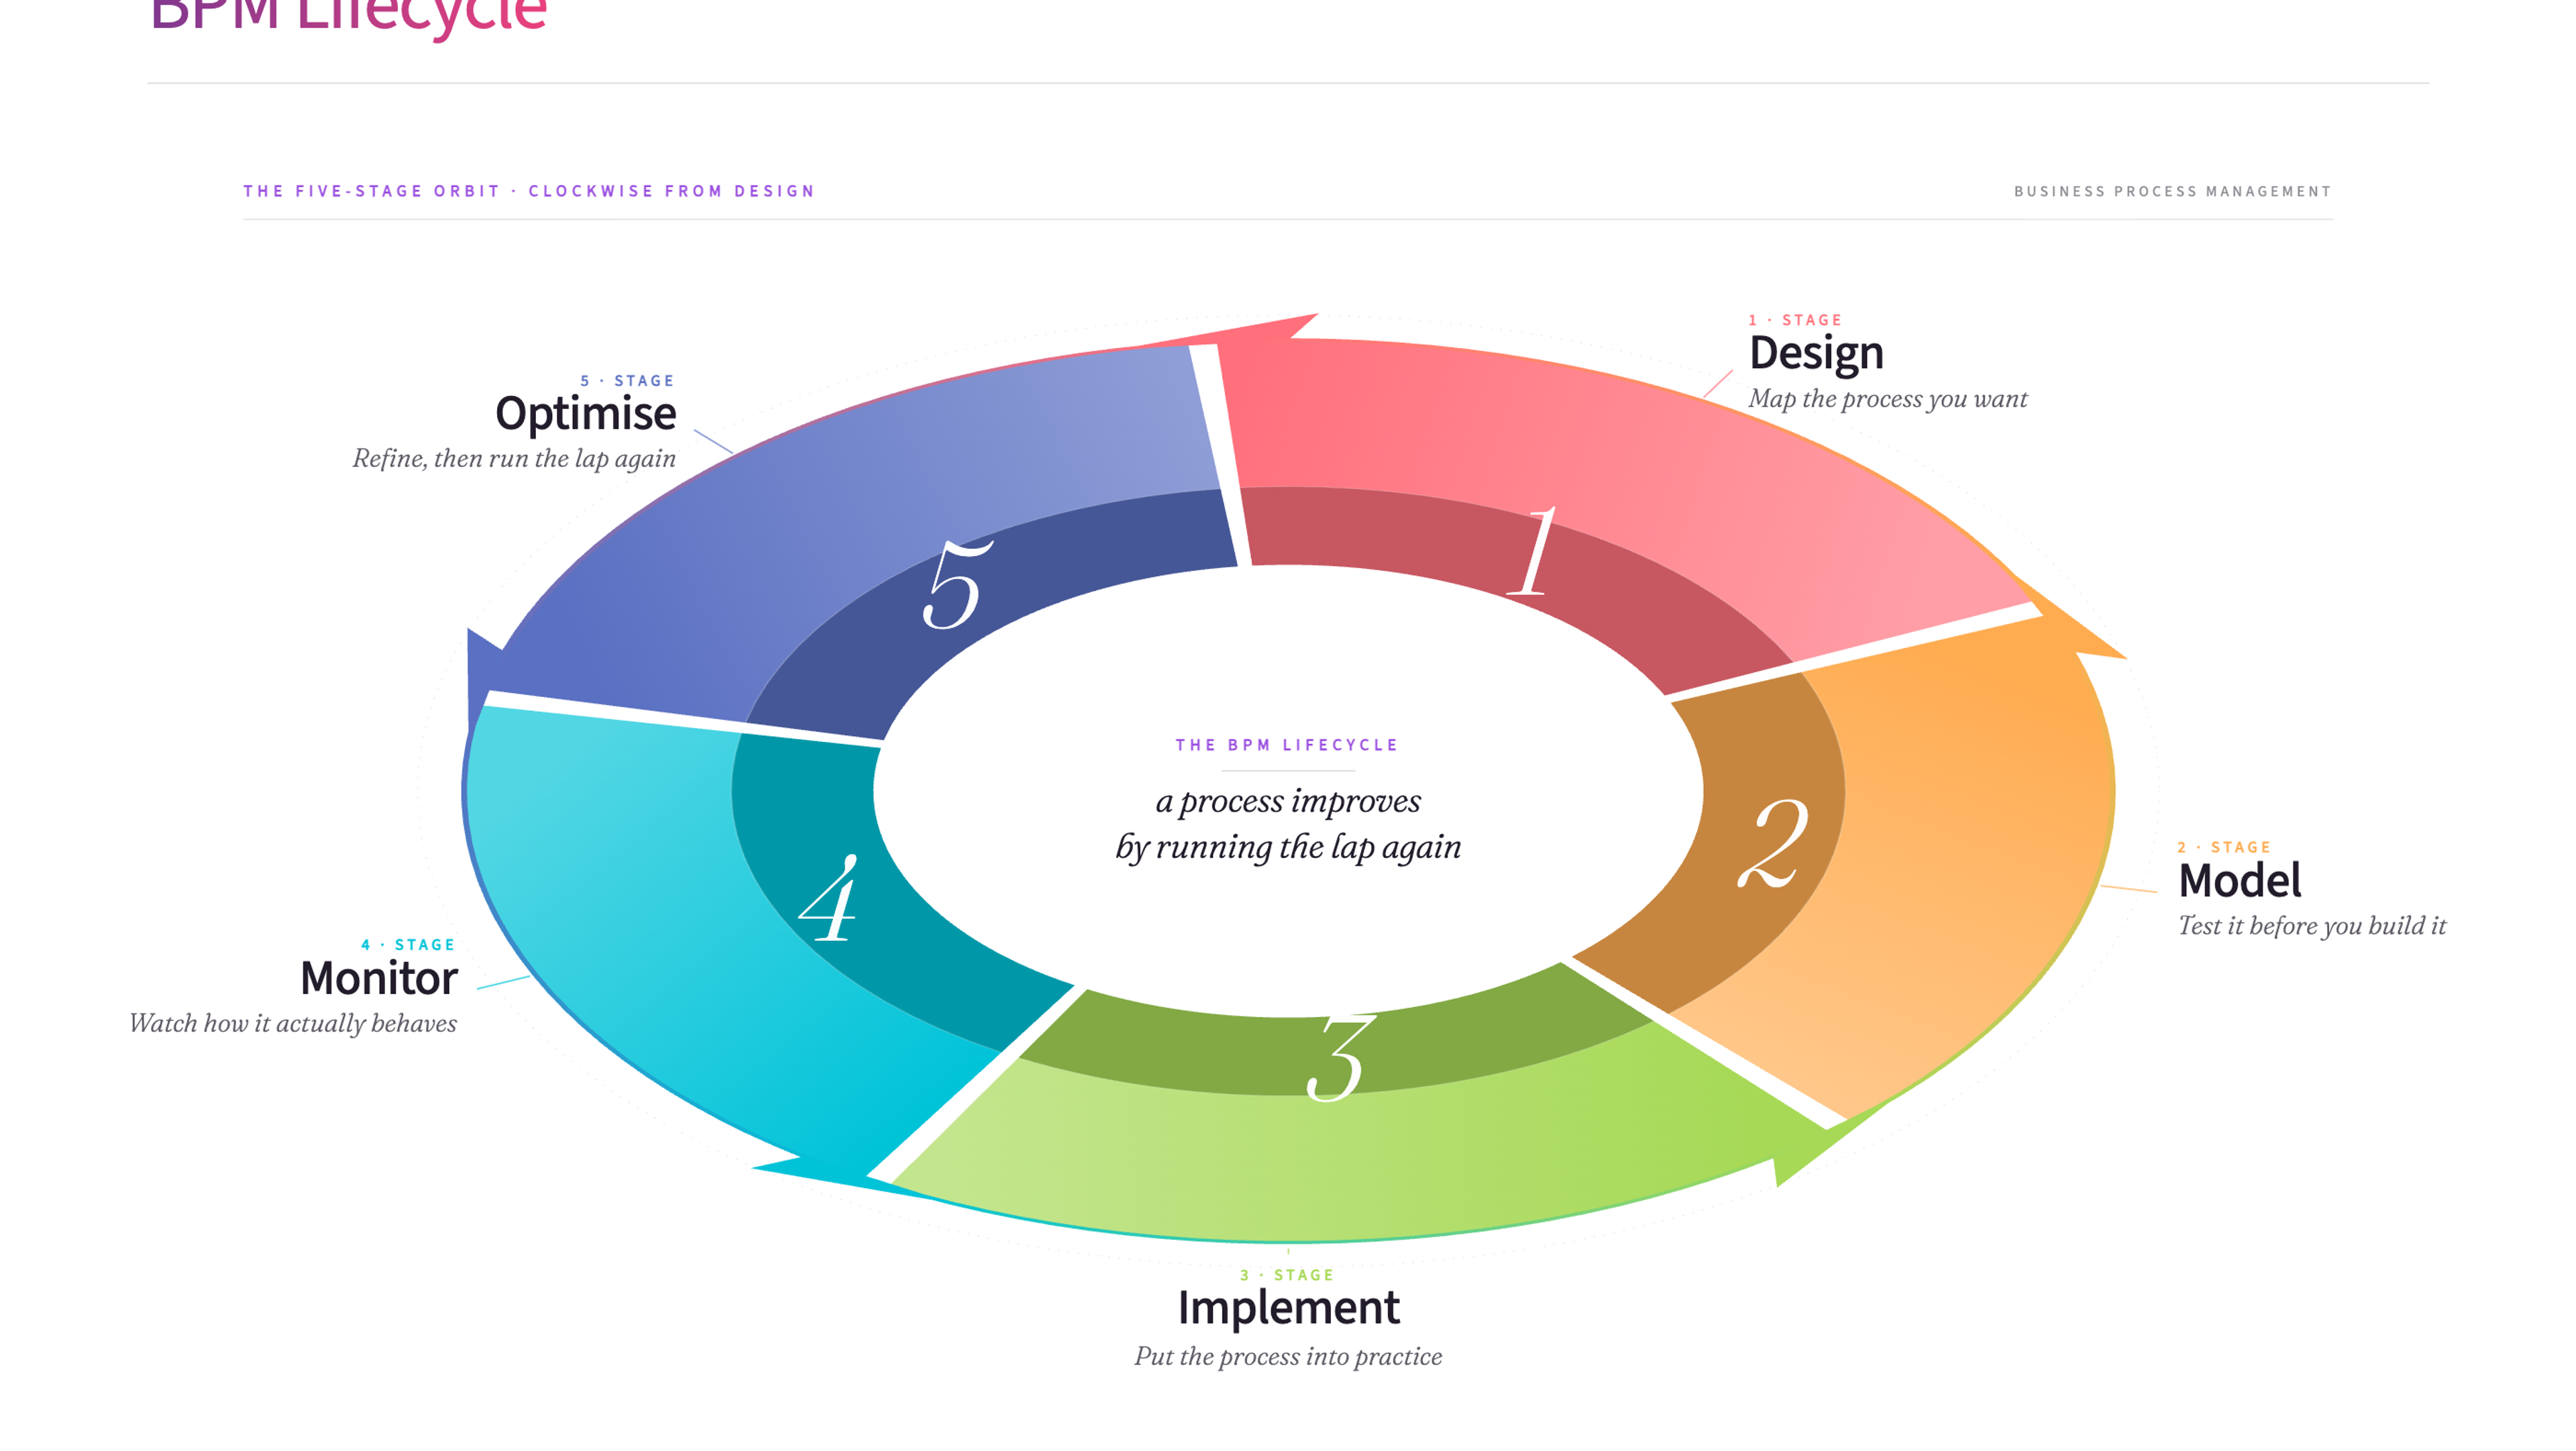
The BPM Lifecycle is a five-stage cycle for designing, modelling, implementing, monitoring, and optimising how work flows through an organisation. Each pass through the cycle - design, model, implement, monitor, optimise - refines the process further.
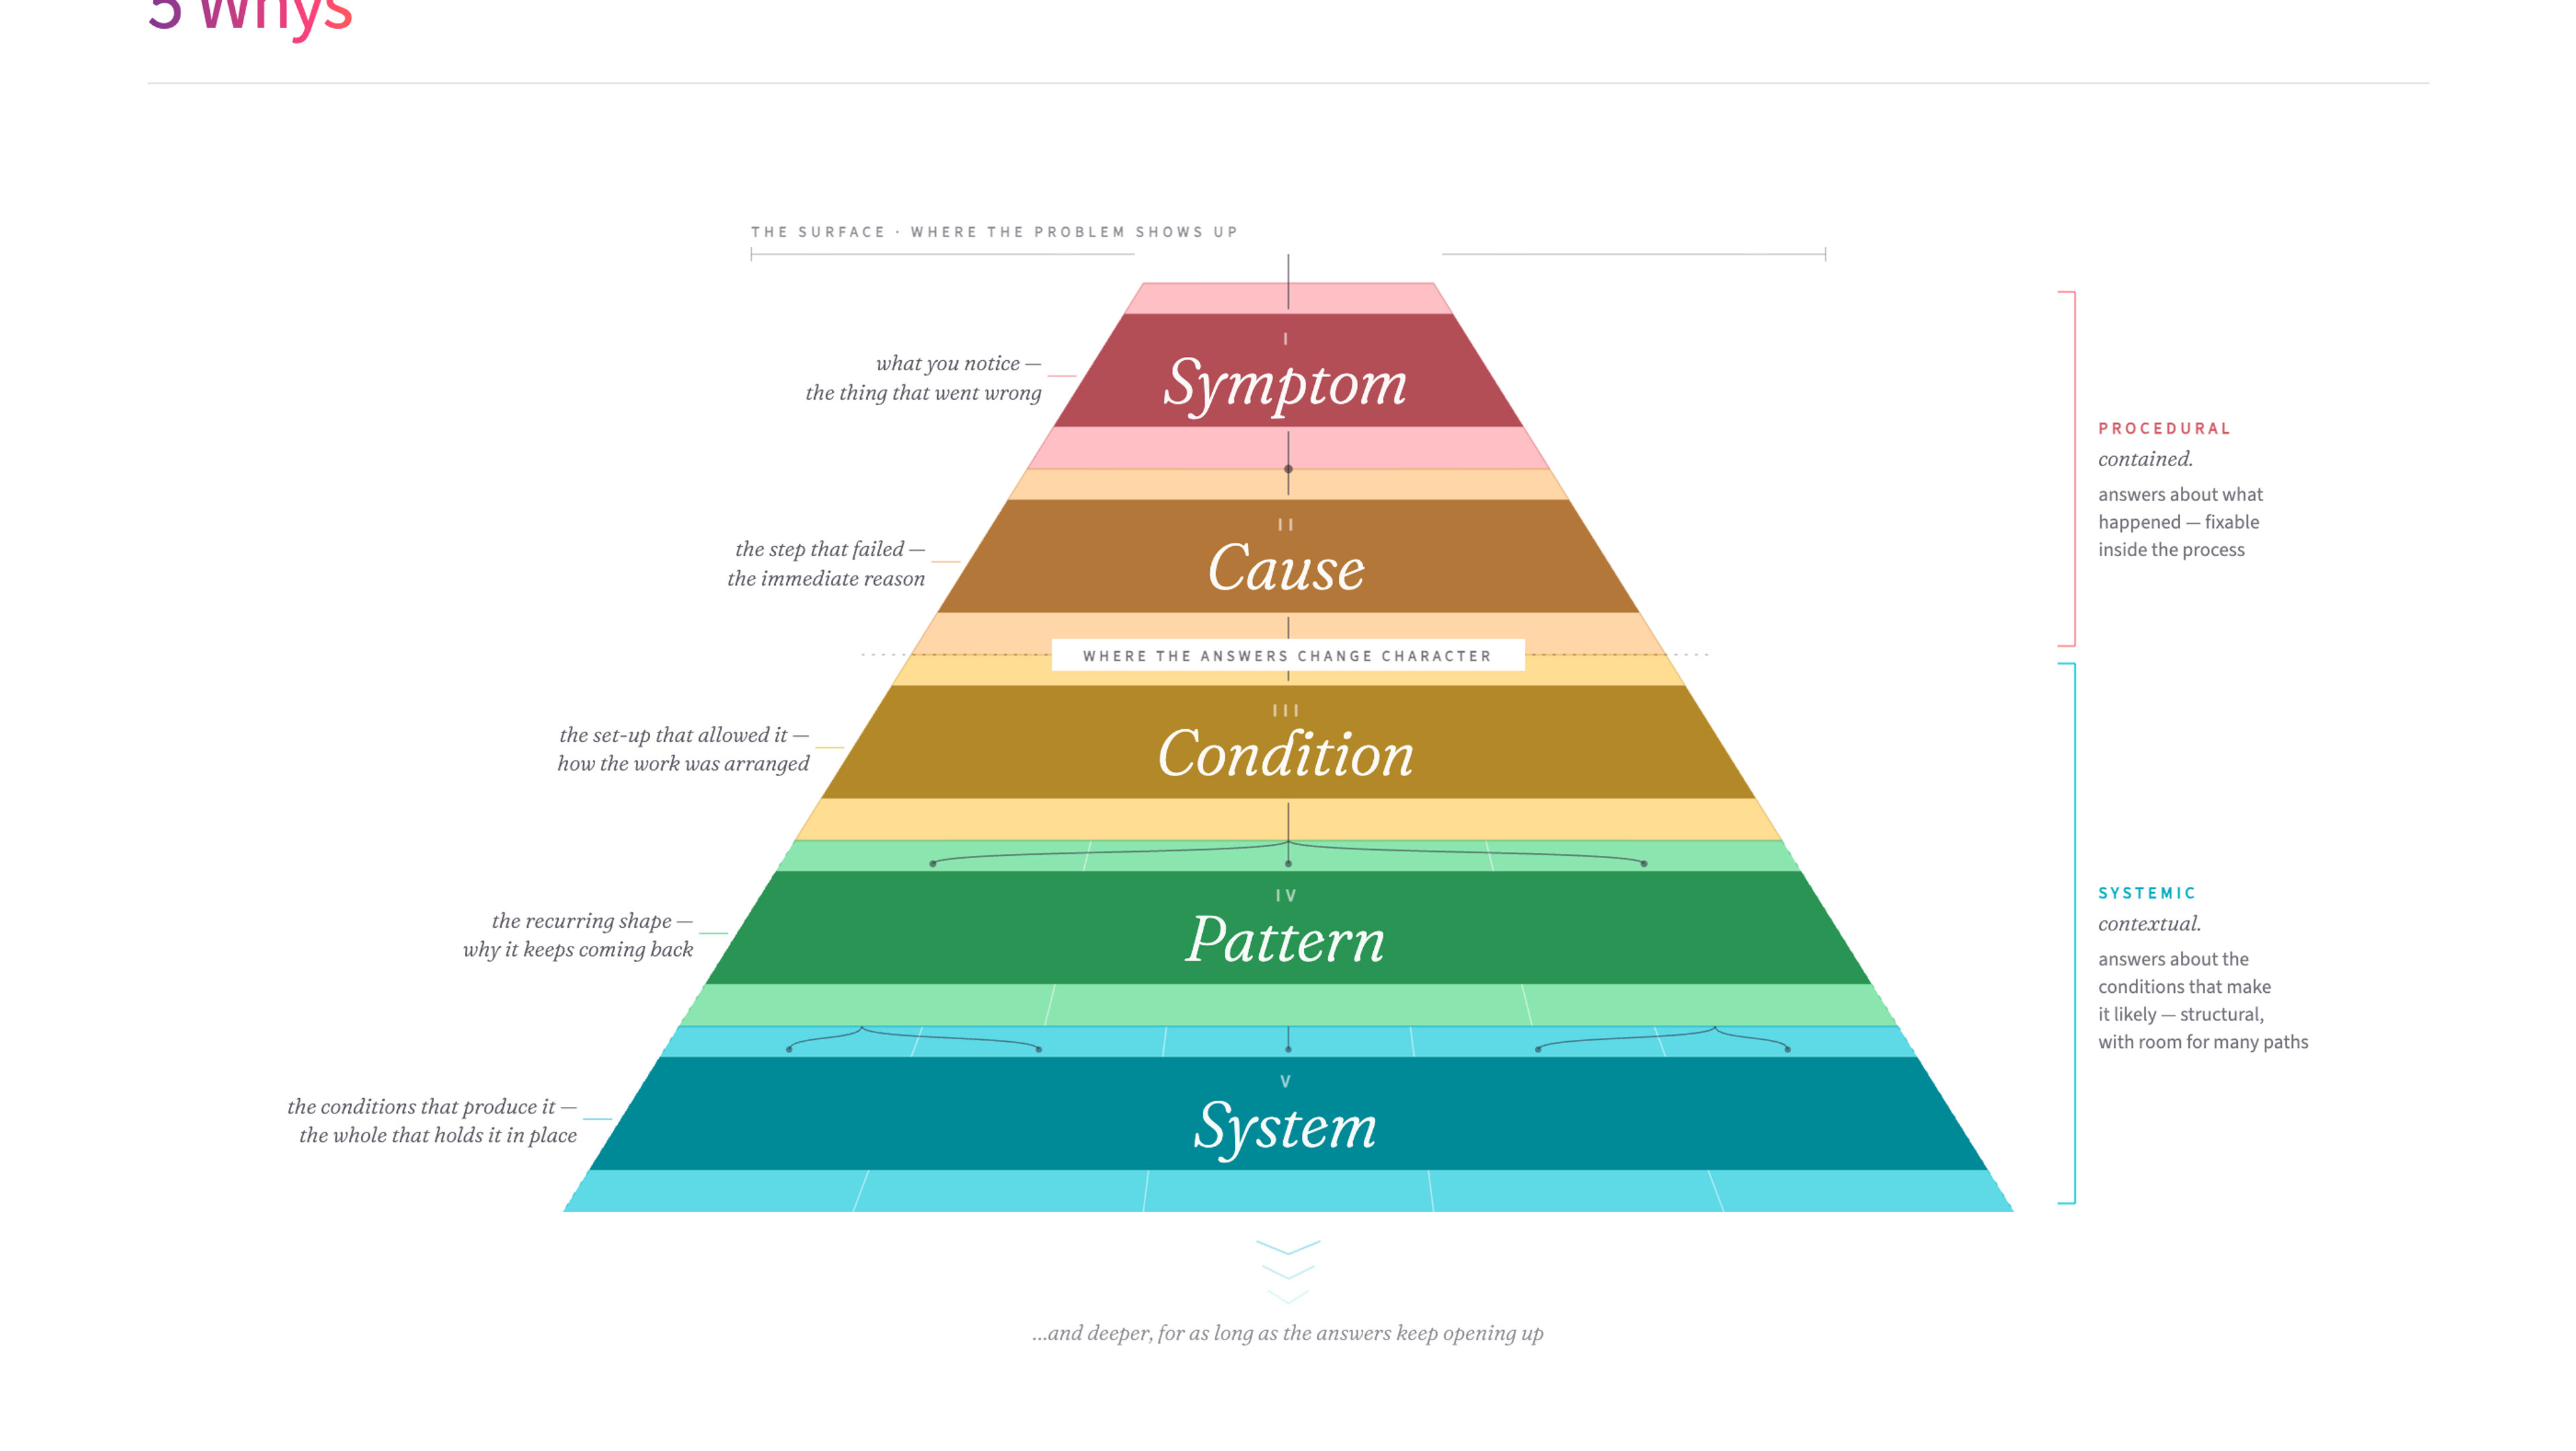
The 5 Whys is a simple root-cause analysis technique that drills into problems by asking "why?" repeatedly. It helps teams get past surface-level symptoms to find the real cause of an issue.
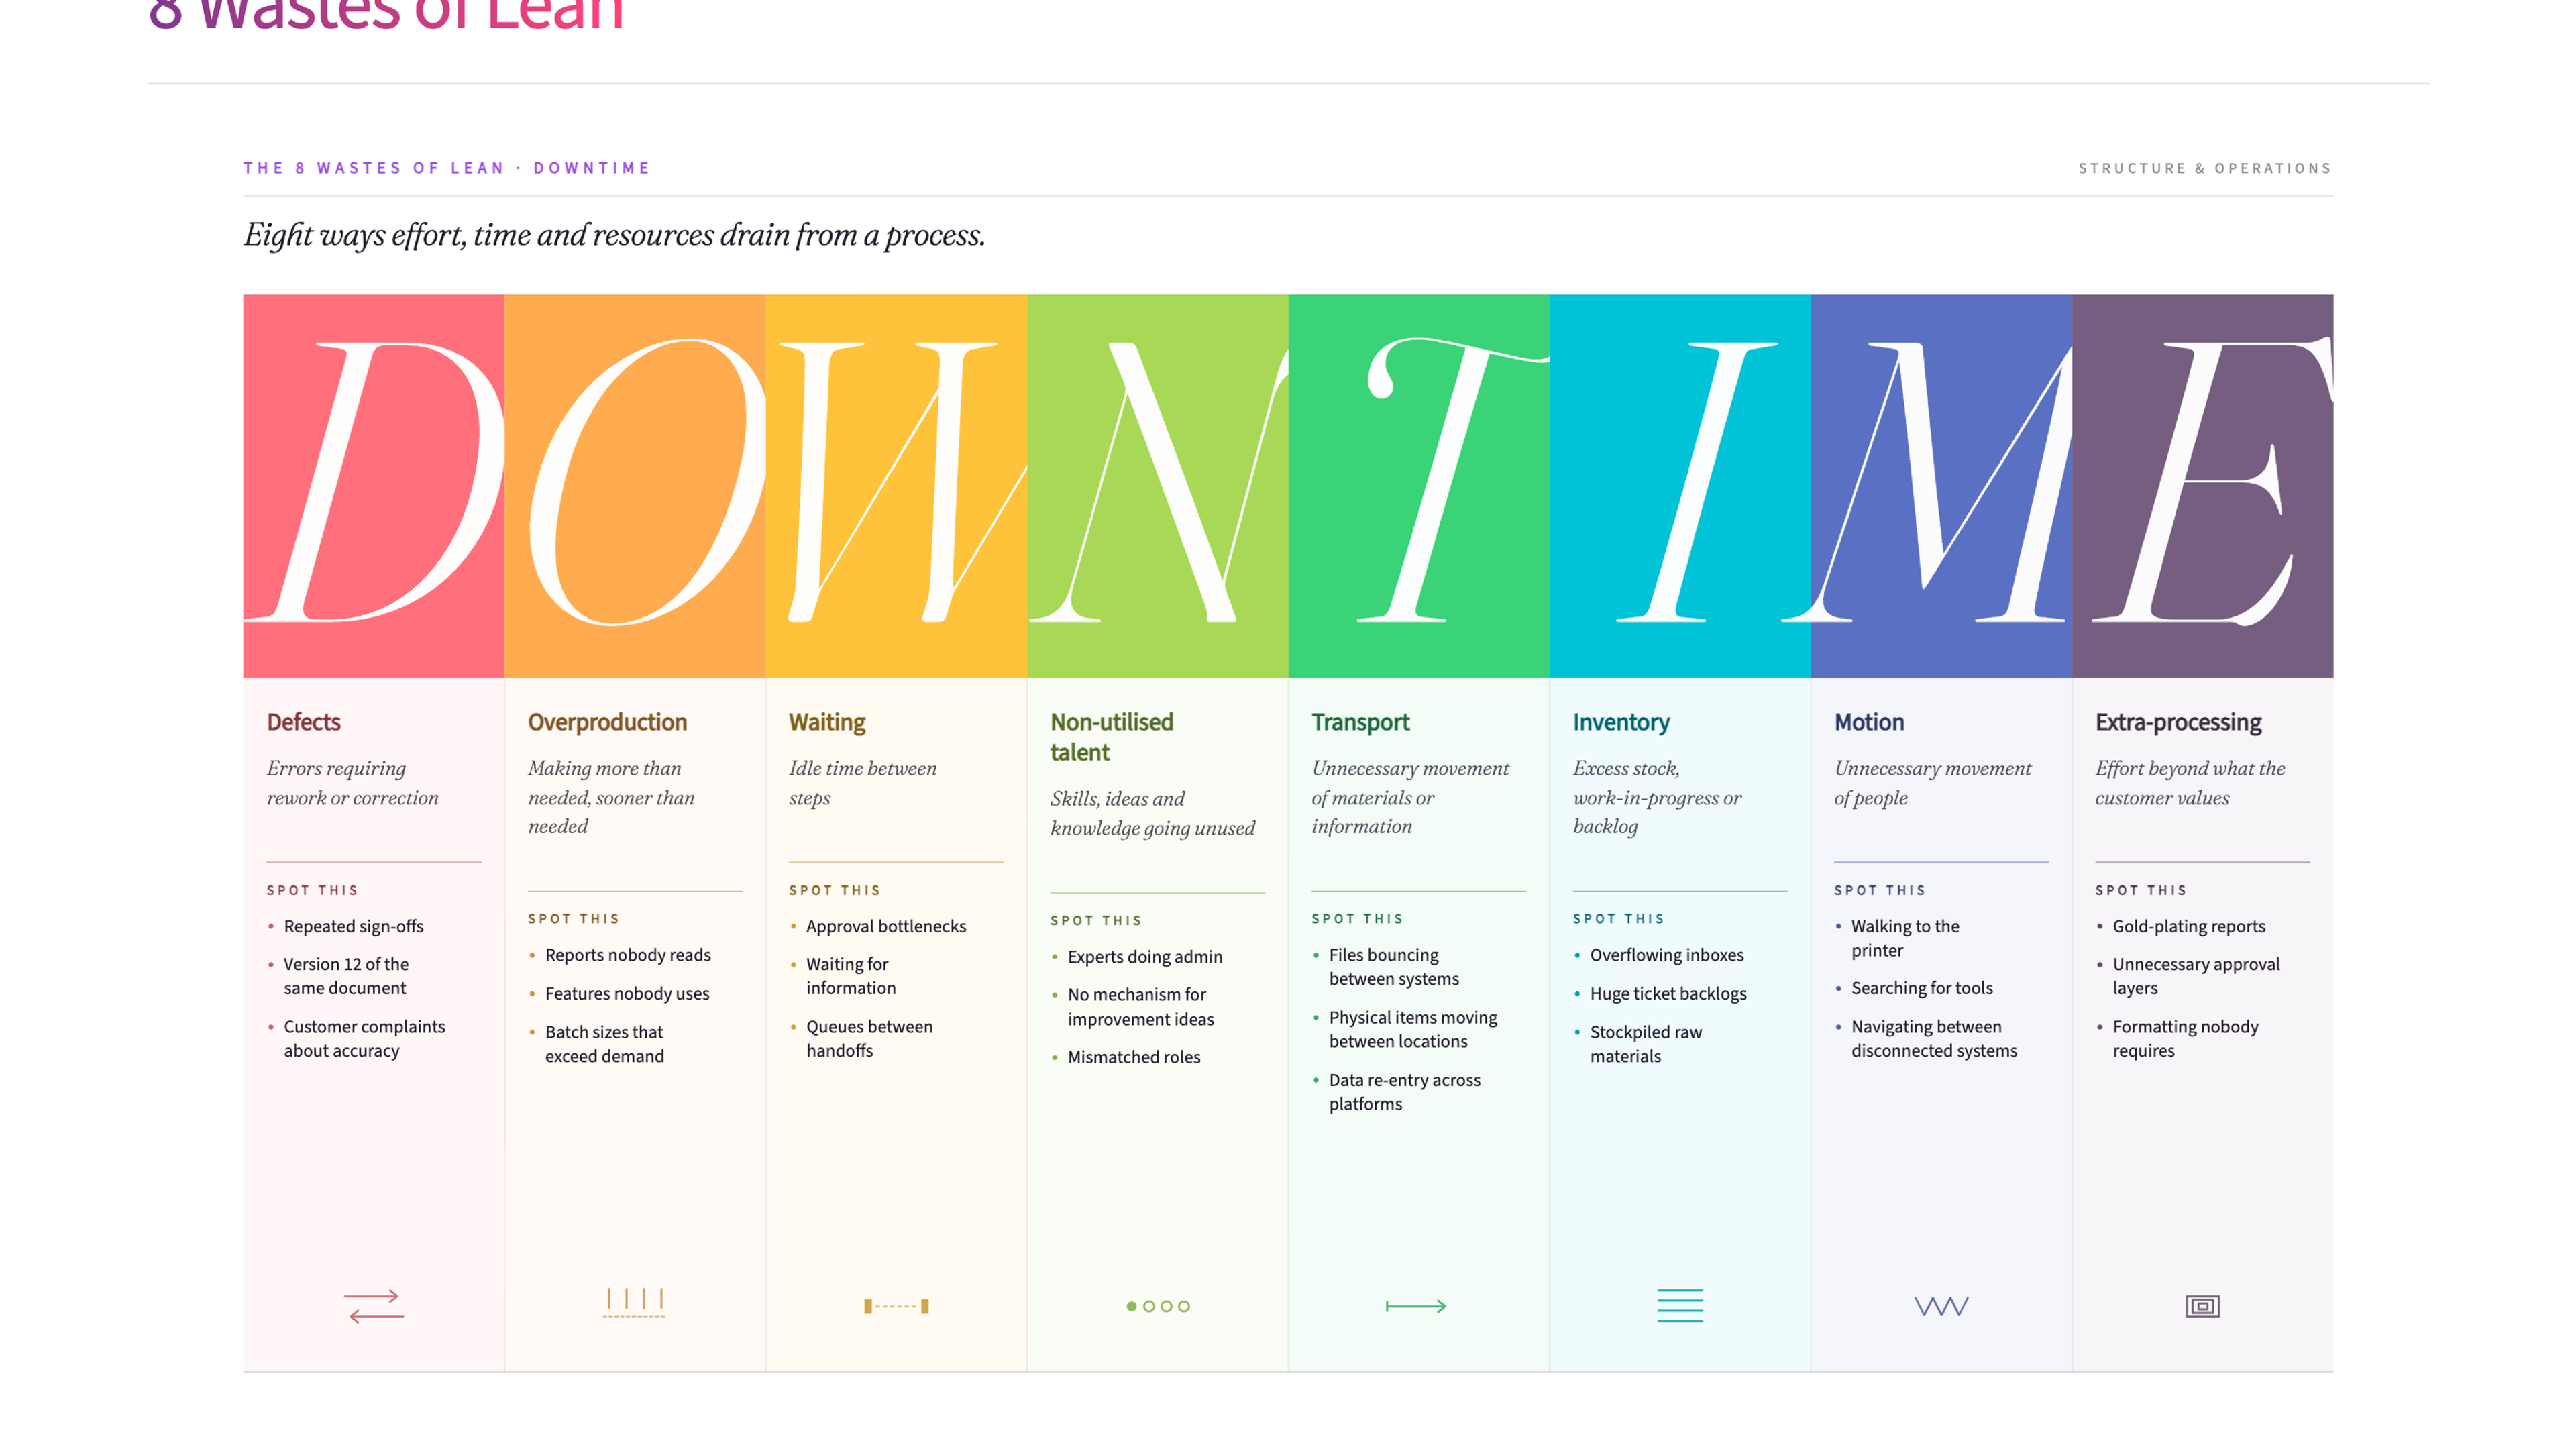
The 8 Wastes of Lean give you eight categories for finding where effort, time and resources leak from a process. Use the DOWNTIME acronym to work through each waste type systematically and build a clear picture of what to improve.
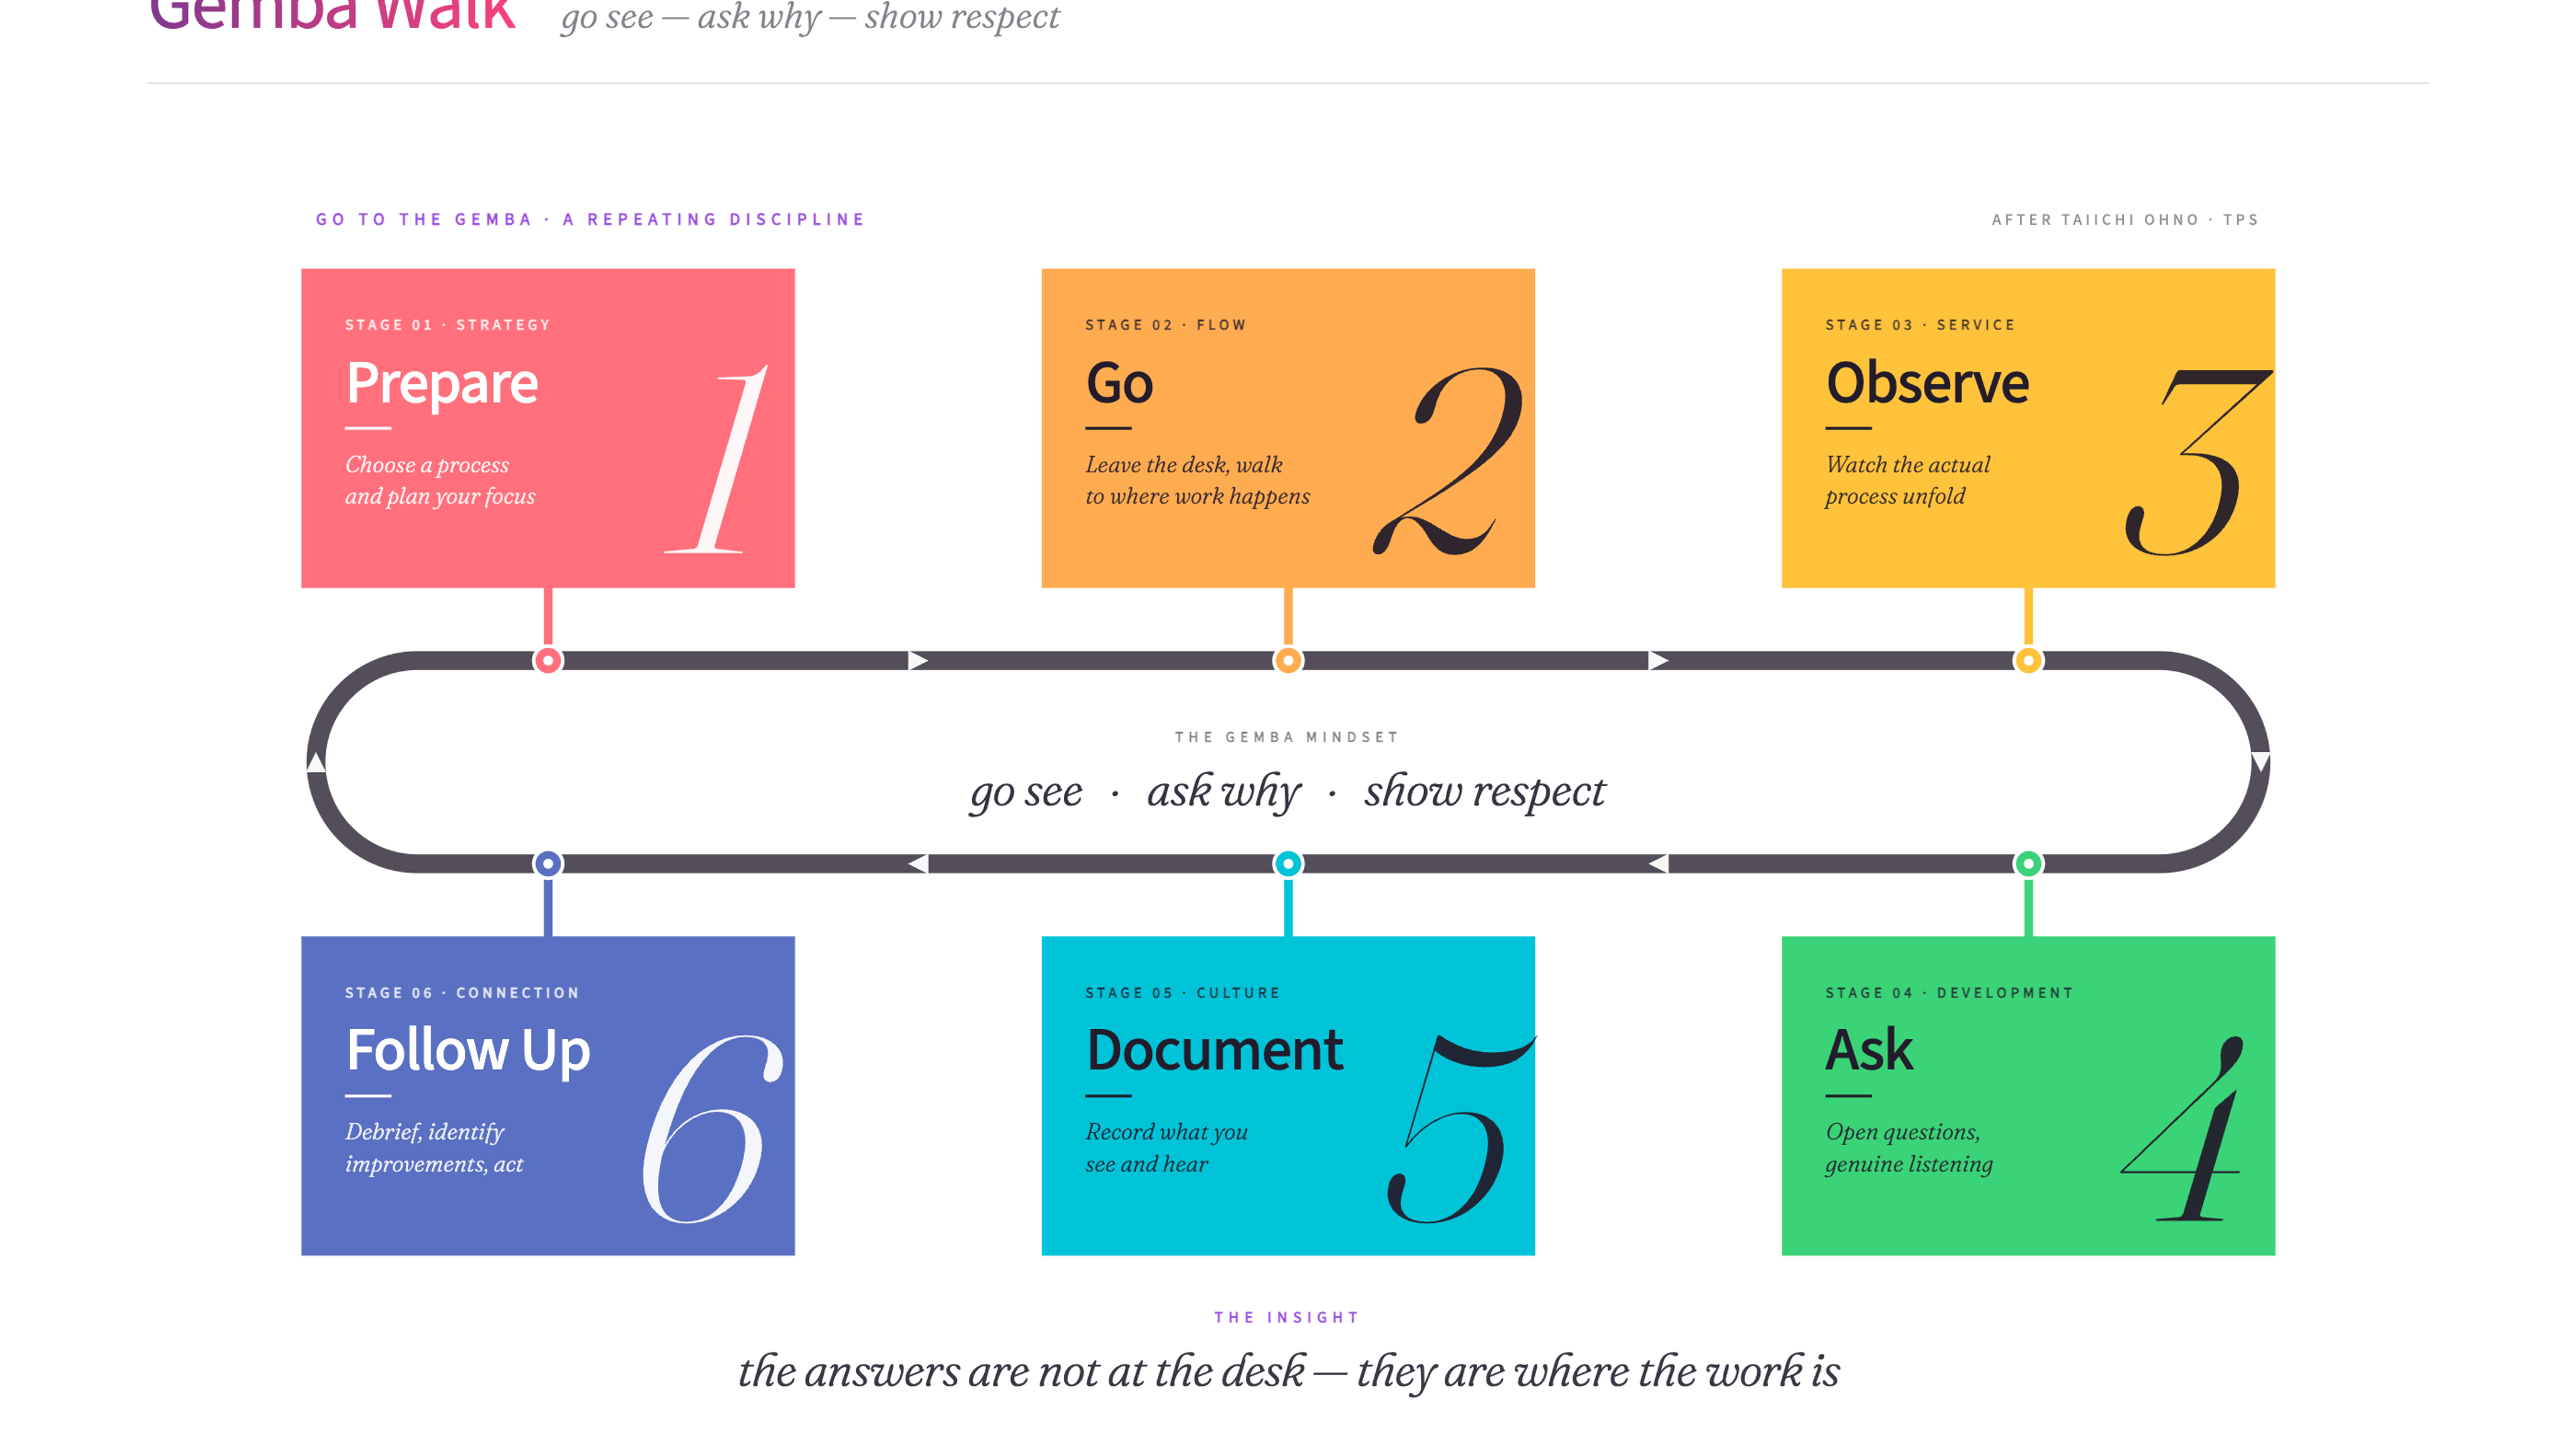
A Gemba Walk is a Lean practice where leaders go to the place where work actually happens to observe, listen, and understand. It bridges the gap between how leaders think work gets done and how it really gets done.
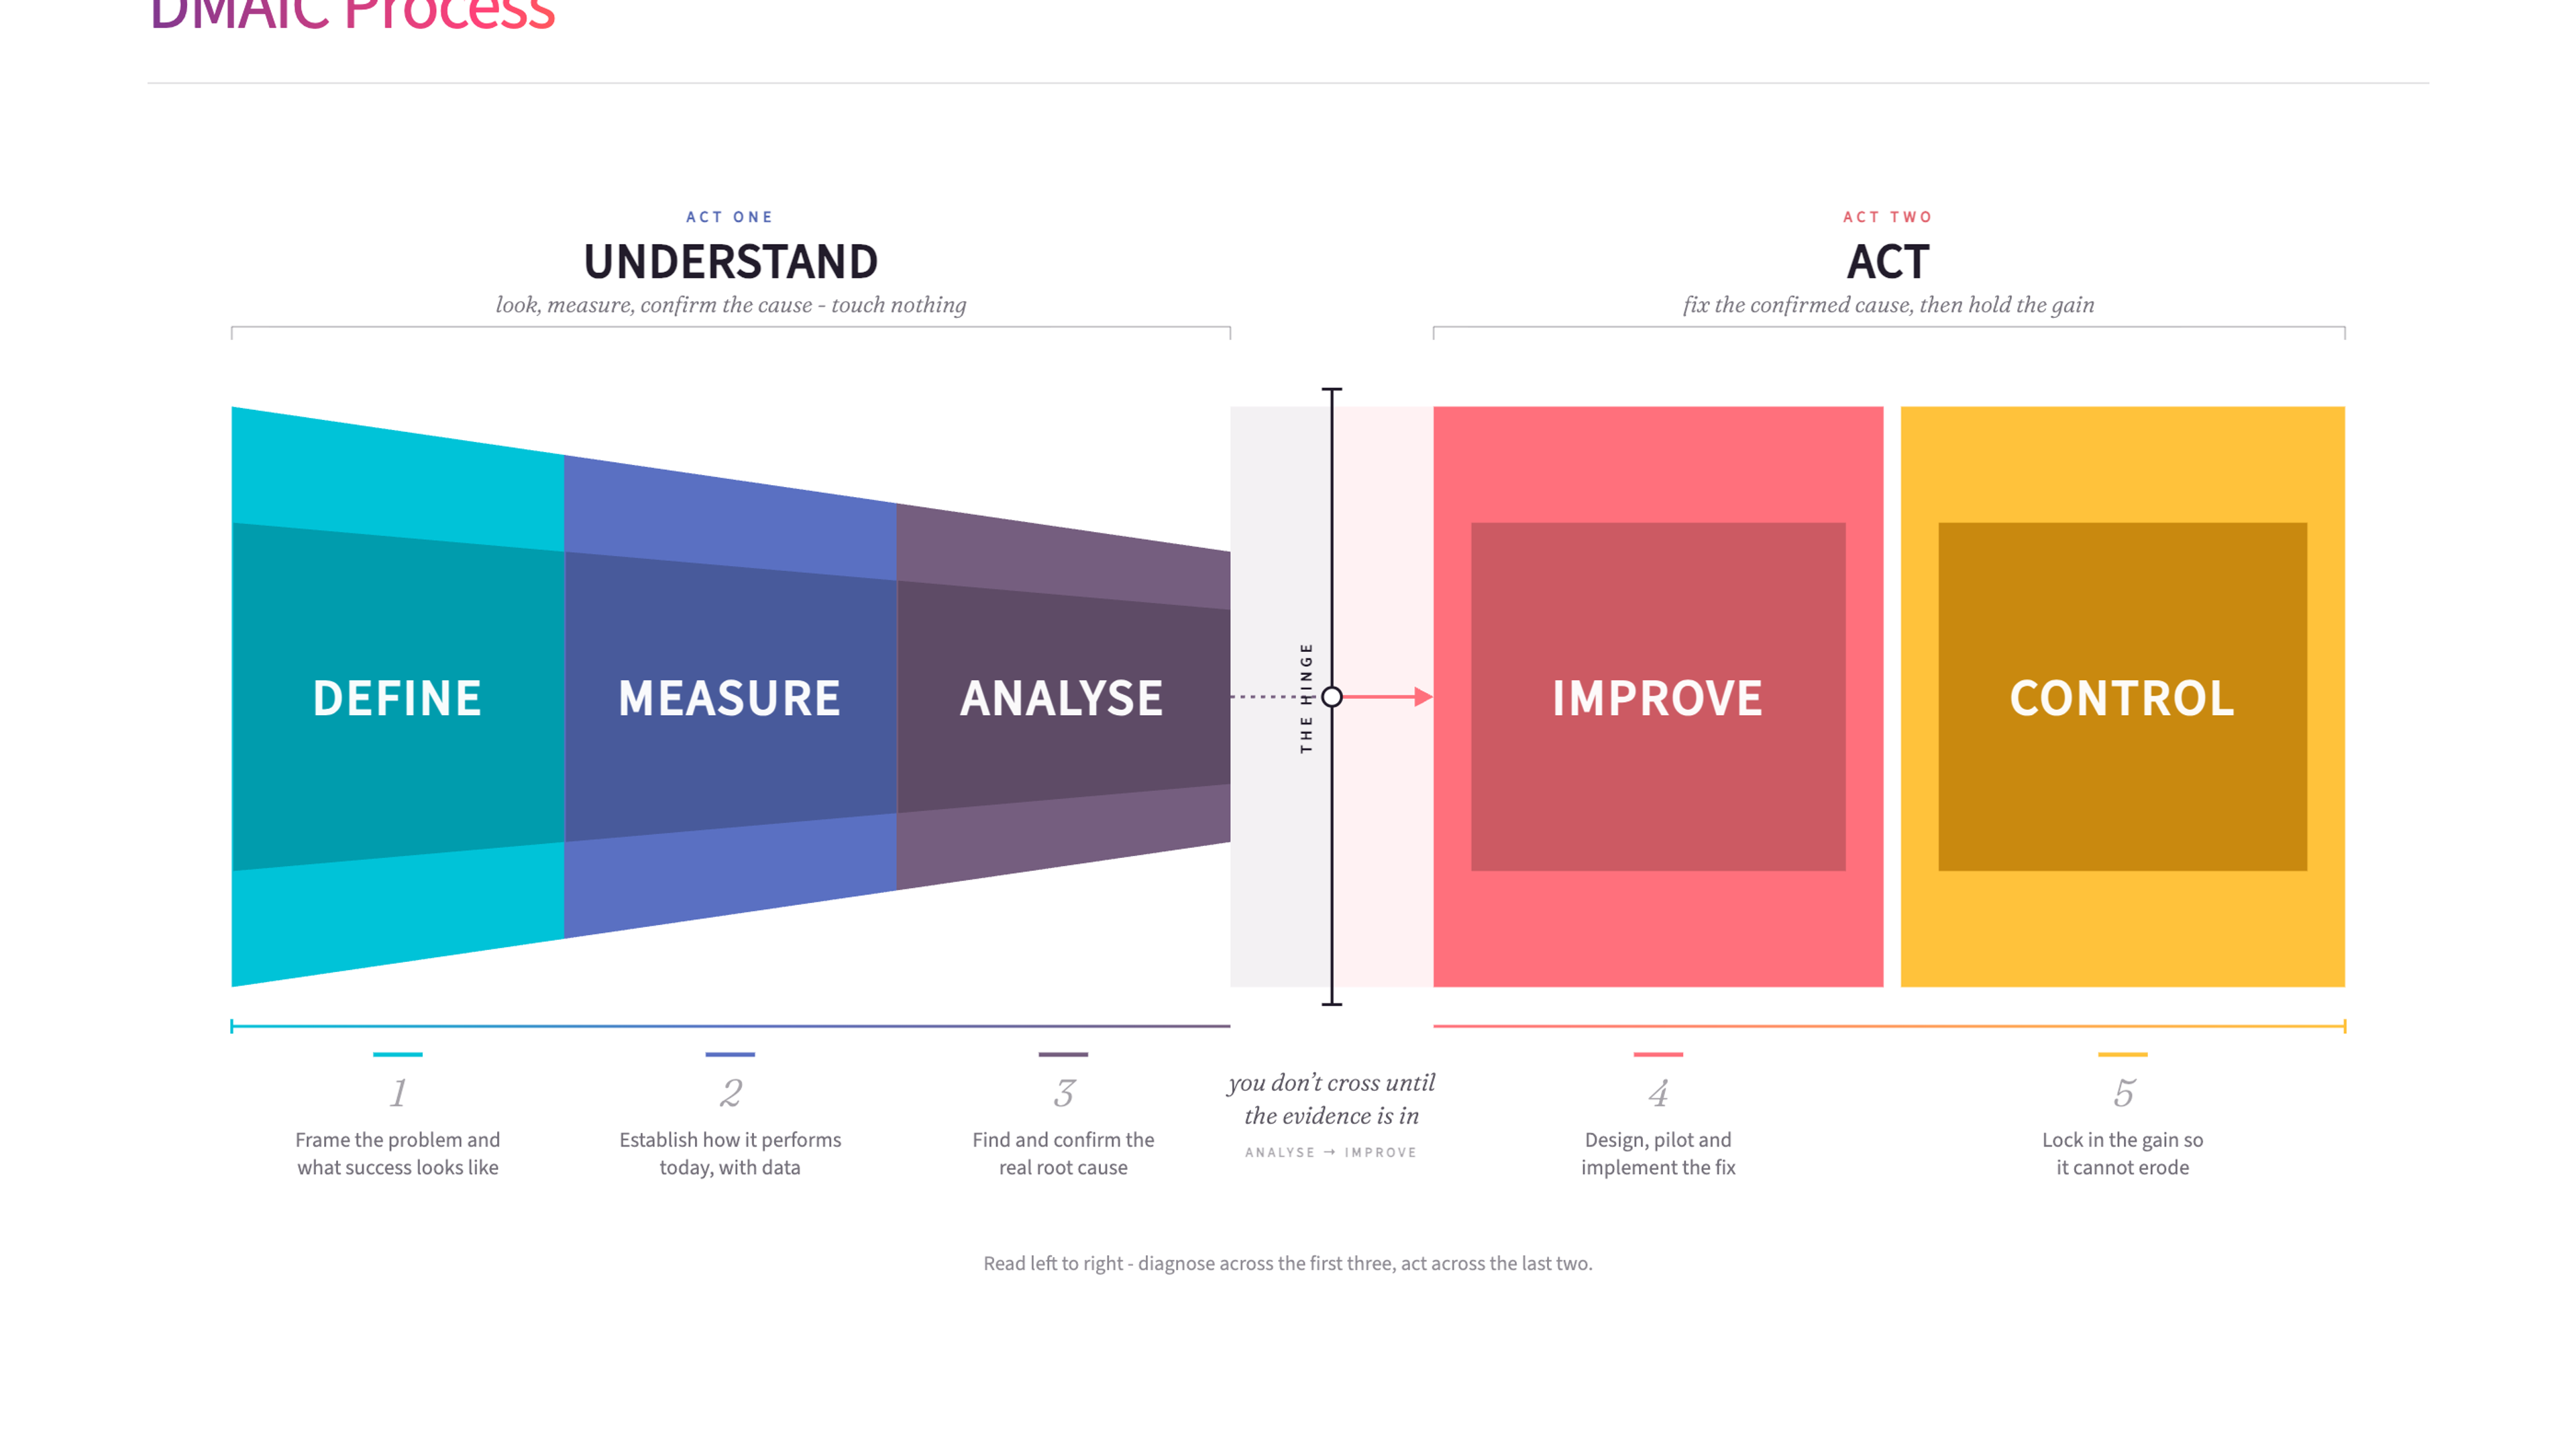
DMAIC (Define, Measure, Analyse, Improve, Control) is a structured problem-solving method from the Six Sigma toolkit. It gives teams a clear five-step process for improving existing processes using data and evidence.
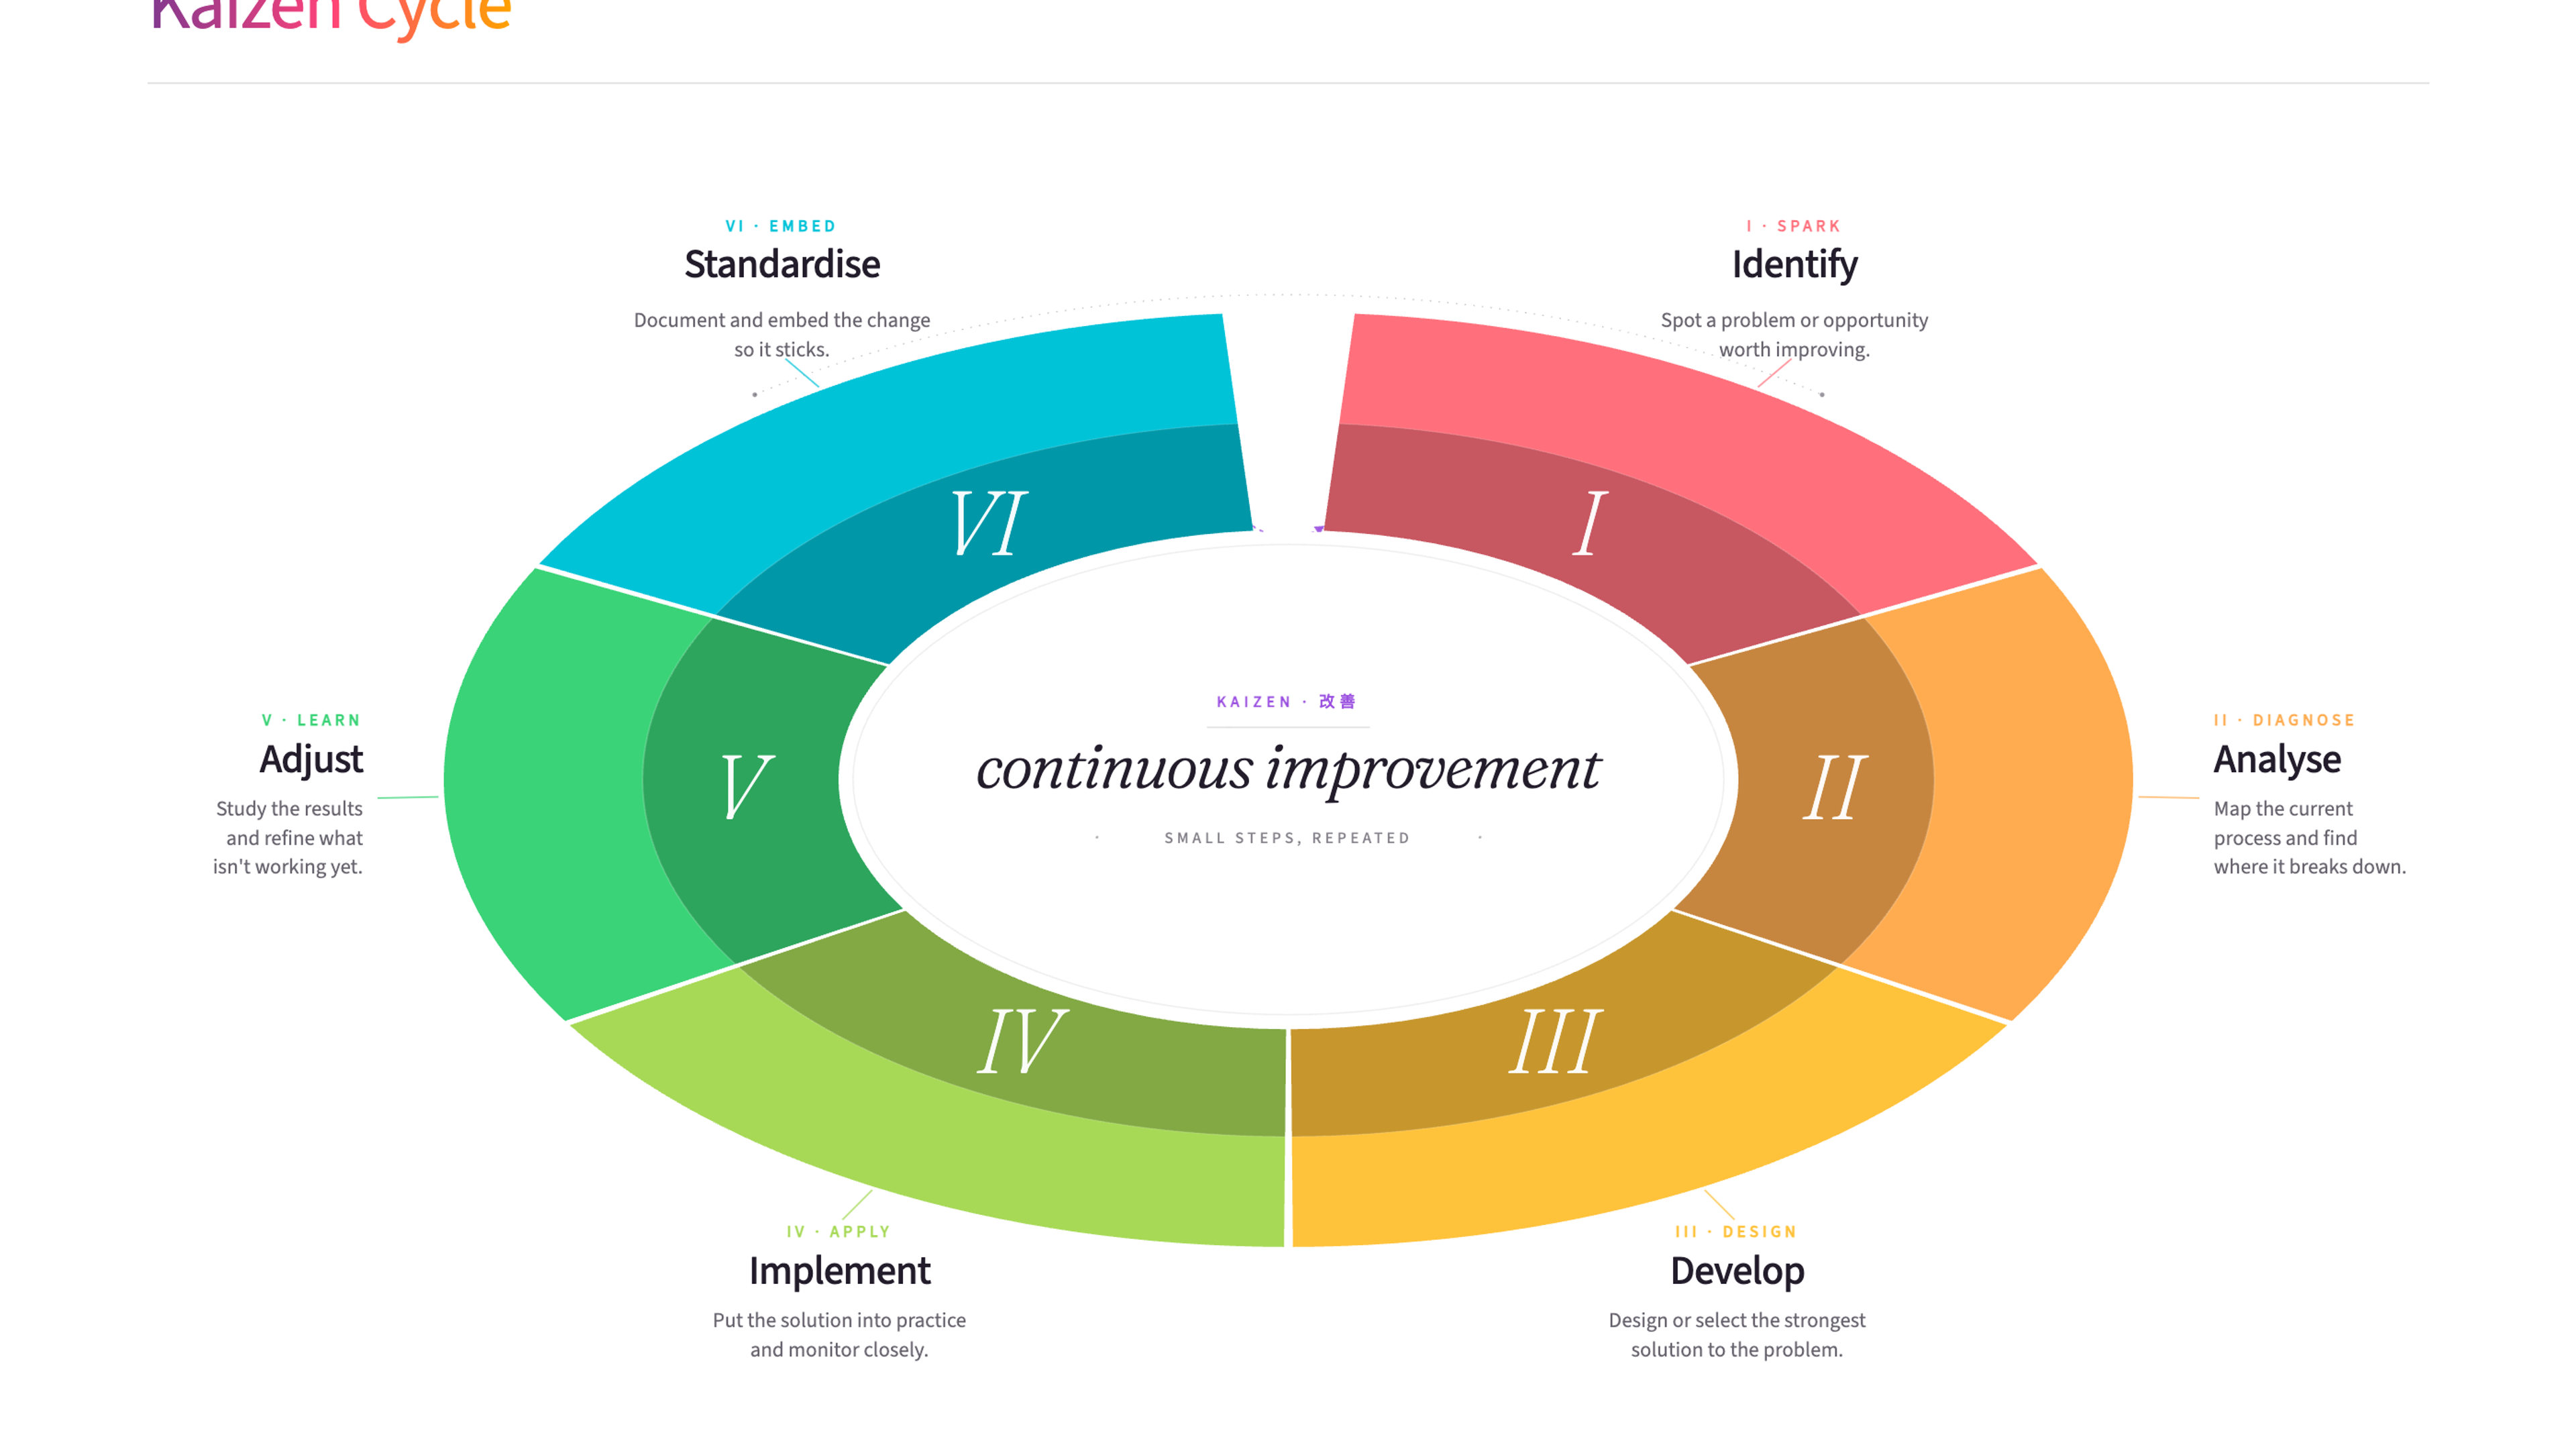
Kaizen is a Japanese continuous improvement philosophy built on the idea that small, ongoing changes add up to significant results over time. The Kaizen Cycle gives teams a structured way to identify improvements, test them, and build them into everyday work.

Every organisation has friction - the unnecessary effort, the needless complexity, the things that make simple work harder than it should be. This article explores how to find it, understand where it comes from, and reduce it without creating new problems in the process.

Most organisations run on invisible infrastructure - the corridor conversation, the person who just knows, the relationships that bridge gaps between teams. Growth puts all of it under pressure. Scaling well means designing what replaces it.
Process Mapping Workshop
This guide gives you the basics; our Process Mapping workshop is the day your team learns to map its own processes well, with us alongside.
James Freeman-Grayis the founder of Mutomorro. He's an organisational development practitioner who has spent over a decade working with leaders across public, private, and nonprofit sectors - helping organisations navigate change, strengthen culture, and design better ways of working.
Process mapping is deceptively simple. Many people have never been trained in how to actually design a process, so the act of making one visible - often for the first time - reveals gaps, duplications, and workarounds that nobody realised existed. The map itself is useful, but the conversation people have while creating it is where the real value lies.
Last reviewed: June 2026
Ready to use Process Mapping?
Download the free template - includes practical guidance for workshops and team sessions.
Get the free templateWant to put these ideas into practice?
Whether you're navigating a merger, rethinking how you're structured, or trying to shift a culture that isn't working - start with a conversation.