Operational Effectiveness Assessment
A clear read of how work actually flows from request to done - and where effort leaks between the steps.

Our operational effectiveness assessment tells you how work actually flows from request to done - not how the process map says it should. We look at six things: the flow of work end to end, the split between value demand and failure demand, cycle time against touch time, where decisions wait, how information moves across boundaries, and how fast the place learns. Then we give you the few places where effort leaks between the steps - what's already flowing well, what's stalling it, and what to work first.
Flow is easy to assume and hard to see from a dashboard, so we study the work where it happens - real jobs, from the moment they arrive to the moment they're done. That's what makes the findings usable, and where any improvement starts.
43% of executives name productivity their top priority for 2026 (McKinsey, State of Organizations 2026). The hard part is seeing where the day actually goes - which is what studying the flow of work gives you.
When an operational effectiveness assessment helps
An assessment earns its place when the same drag keeps showing up in the work and you need to see where it comes from:
The situation | How it helps |
|---|---|
Work takes far longer than the hands-on time in it | Shows where jobs sit waiting between steps, so you shorten the queue, not rush the people. |
The team is flat out, but throughput isn't moving | Measures how much of the load is failure demand - work that only exists because something didn't land first time. |
Everything needs a sign-off before it can move | Reads where decisions wait and who has to be in the room, so authority sits closer to the work. |
Jobs stall every time they cross a team boundary | Traces the handoffs and what gets lost in each one, so the flow holds across the seams. |
You're scaling, and the way work runs won't stretch | Gives you a clear read of how the operation flows now, before more volume makes the leaks expensive. |
Improvements are made, then the old way creeps back | Reads how the place learns - whether a fix sticks or quietly unwinds - and what would make the next one hold. |
What we look at
We study one thing above all: how work moves from the moment a request arrives to the moment it's done. We read that through six angles - the lenses we use to find where effort leaks between the steps rather than inside them:

Flow of work end to end
How a job travels from request to done, and where it stops moving. We follow real jobs, not the process map - the two usually differ in instructive ways.
Following a handful of recent jobs from arrival to done shows where work queues, loops back, or waits for attention. You see the operation the way the work sees it - which is the view that explains the lead times.

Value demand and failure demand
How much incoming work is the job itself, versus work created because something didn't land first time. The split is measurable, and most operations have never measured it.
We classify a live sample of incoming demand at the point it arrives - a John Seddon discipline that changes how you see workload. Every point of failure demand you design out is capacity returned to the work you exist to do.

Cycle time and handoffs
The elapsed time a job takes against the touch time actually worked on it. The ratio between the two is one of the quickest reads on any operation - and one of the most improvable once seen.
We time both across a sample of real jobs and mark every handoff along the way. Each handoff is a queue in waiting, so the count itself is a finding - and it gives you a shortlist of joins to simplify.

Decision latency and autonomy
How long work waits for a call, and whether the person doing it can make one. Often the approval was designed for a risk that no longer exists at that step.
We log where jobs pause for decisions, for how long, and what each decision actually protected. That separates the approvals earning their keep from the ones ready to move to the point of work - usually with a gain in quality as well as speed.

Information flow across boundaries
Whether what a step needs arrives with the work, or gets chased after it. Chasing is quiet work - it books no time code and appears in no report.
We check, at each boundary, what the receiving step needs and what it actually gets. The shortfalls become a specification for each handover - often a one-page fix that removes a week of accumulated chasing.

Improvement metabolism
How quickly the operation spots a problem, fixes it, and makes the fix hold. This is the angle that decides whether the other five findings stay fixed.
We trace recent fixes: how the problem surfaced, how long the fix took, and whether it held. An operation that already metabolises small problems well can be trusted with bigger changes - a genuine strength worth knowing you have.
The six angles stay constant; how we read them, we shape around you - your work types, volumes, teams, systems and where delivery actually happens - so the picture fits your operation, not a template.

Why these six angles
We read flow rather than function because flow is where the time goes and where you can actually shift it. Most of the wait in a job isn't in the work - it's between the steps, in the queues and handoffs no single team owns. The six angles are how we find that space, because a job that spends a fortnight in the system and an afternoon being worked on is telling you something the org chart never will.
Value demand and failure demand is the master signal. Value demand is the work you exist to do; failure demand is work that only landed because a prior step didn't deliver - the chaser, the rework, the call to fix what should have worked. In service operations it is often a large share of the load, and it's usually invisible because it looks exactly like busy. Naming the split, on real incoming work, is where the biggest gains hide.
Cycle time against touch time reads the flow itself. Decision latency and point-of-work autonomy read why it waits - work sitting for a sign-off it didn't need. Information flow reads what each step arrives with, or has to chase. And improvement metabolism reads whether the operation can mend itself, because a place that learns fast leaks less over time. These six are our lens, refined across many operations, and deliberately about how work moves, not how it's drawn.
How it works
You can't read this off a process map or a dashboard - both show the work as designed, not as it runs. So we study the work where it happens, through more than one lens, so the findings hold up:
- We measure it - a demand analysis on real incoming work, separating value demand from failure demand, and a flow walk timing jobs end to end - elapsed time against touch time. We show you the spread across job types and teams, not just the average. The variation is usually where the story is.
- We watch, at the point of delivery - time spent where the work is actually done, following real jobs through the handoffs and queues, so we see what happens between the steps, not only within them.
- We listen - interviews across a cross-section - the leaders and the operational teams doing the work. We look at real, recent jobs: what actually happened, and where the flow stalled or doubled back.
- We make sense of it - drawing on years of operational-development work, we read the gap between the process as drawn and the work as run, and bring you where effort leaks between the steps.
The thinking behind the method
No single method captures a flow on its own, so we use several and cross-check them. A demand analysis tells you what work is arriving and why, but not how it then travels. A flow walk times the journey, but a dashboard average hides how differently one job type moves from another. Watching at the point of delivery shows what people actually do with a job, rather than what the system says happens to it. Used together, they triangulate: a finding has to show up in more than one before we treat it as real.
We separate value demand from failure demand on real incoming work rather than assuming the split, because failure demand hides in plain sight - it looks like a busy, productive team, when much of the load is work the system created for itself. Counting it on live requests is the difference between guessing at the leak and seeing it. The artefact we build from the flow walk is a map of exactly that: where effort leaks between the steps.
We interview the operational teams alongside the leaders, on purpose. The people running the work can see the queues and workarounds that never reach a report, and the gap between the view from the top and the view from the front line is frequently the most useful thing we find. And we show you the spread, not the average, because a flow isn't one number: the same operation can move one job type in hours and another for weeks.
What you get
A working session, not a report filed and forgotten. We walk you through:

- A clear picture of how work flows now - end to end, in practice.
- The parts already flowing well - not just where it stalls.
- The few places effort leaks between the steps, and why.
- The handful of changes that would free up the most flow.
Where two things are both true and in tension - "we want work to move faster" and "nothing ships until it's been signed off" - we show you both. That's usually where the useful conversation starts.
How we hand it back - and what happens next
The assessment ends in a working session, not a document dropped in your inbox. We take you through what we found in person, with the flow walk and the demand split in front of you, so it lands as something you understand and can use.
Some of the most useful findings come as pairs - two things both true and pulling against each other, like wanting speed while requiring a sign-off for every step. We name those tensions rather than smoothing them into one tidy message, because the tension is usually the thing worth working on.
From there it's your call. Sometimes the map is enough and you carry the improvement forward yourselves. Sometimes you want us alongside for the work that follows - a focused fix, or a fuller operational improvement programme. And if what you need turns out to be lighter than you feared, we'll say so.
Focused now, or continuous over time
This is a focused, one-off deep read of how your work flows right now. If what you want is the whole organisation tracked continuously - flow as one thread among eight - that's States of Vitality, our organisational-health platform. Different job: depth now, versus the wider picture over time.
Common questions
How is this different from a time-and-motion or efficiency study?
A time-and-motion study speeds up the steps; this reads whether the steps should be happening at all. We separate value demand from failure demand, and time the elapsed journey against the touch time, so you see the wait between steps - the queues and handoffs - not just the pace of the work inside them. That's where most of the time actually goes.
Who do you involve?
The leaders and the operational teams doing the work. We time real jobs and interview across levels, teams and job types, because the people running the flow can see the queues and workarounds that never reach a report - and the gap between the view from the top and the view from the front line is where the value is.
How long does it take?
It's usually weeks rather than months, but it depends on the size of your operation, how many work types you run, and how complex the flow is. We build each assessment around you, and agree the timeline when we scope it.
How much does it cost?
There's no standard price - we build each assessment around you, so the cost reflects the size of your operation, the scope, and the depth you need. We scope it with you and give you a clear figure before you commit.
Is it confidential?
Yes. Interviews are confidential, and we report in flows, patterns and groups - by job type, step and team - never in a way that identifies an individual or singles out a person's numbers.
Is this a Lean or process-improvement project?
No - the assessment reads where effort leaks first, before anyone changes a step. The improvement work is what may follow, and it lands better for starting from a clear read of how the work actually flows rather than a guess at where to cut.
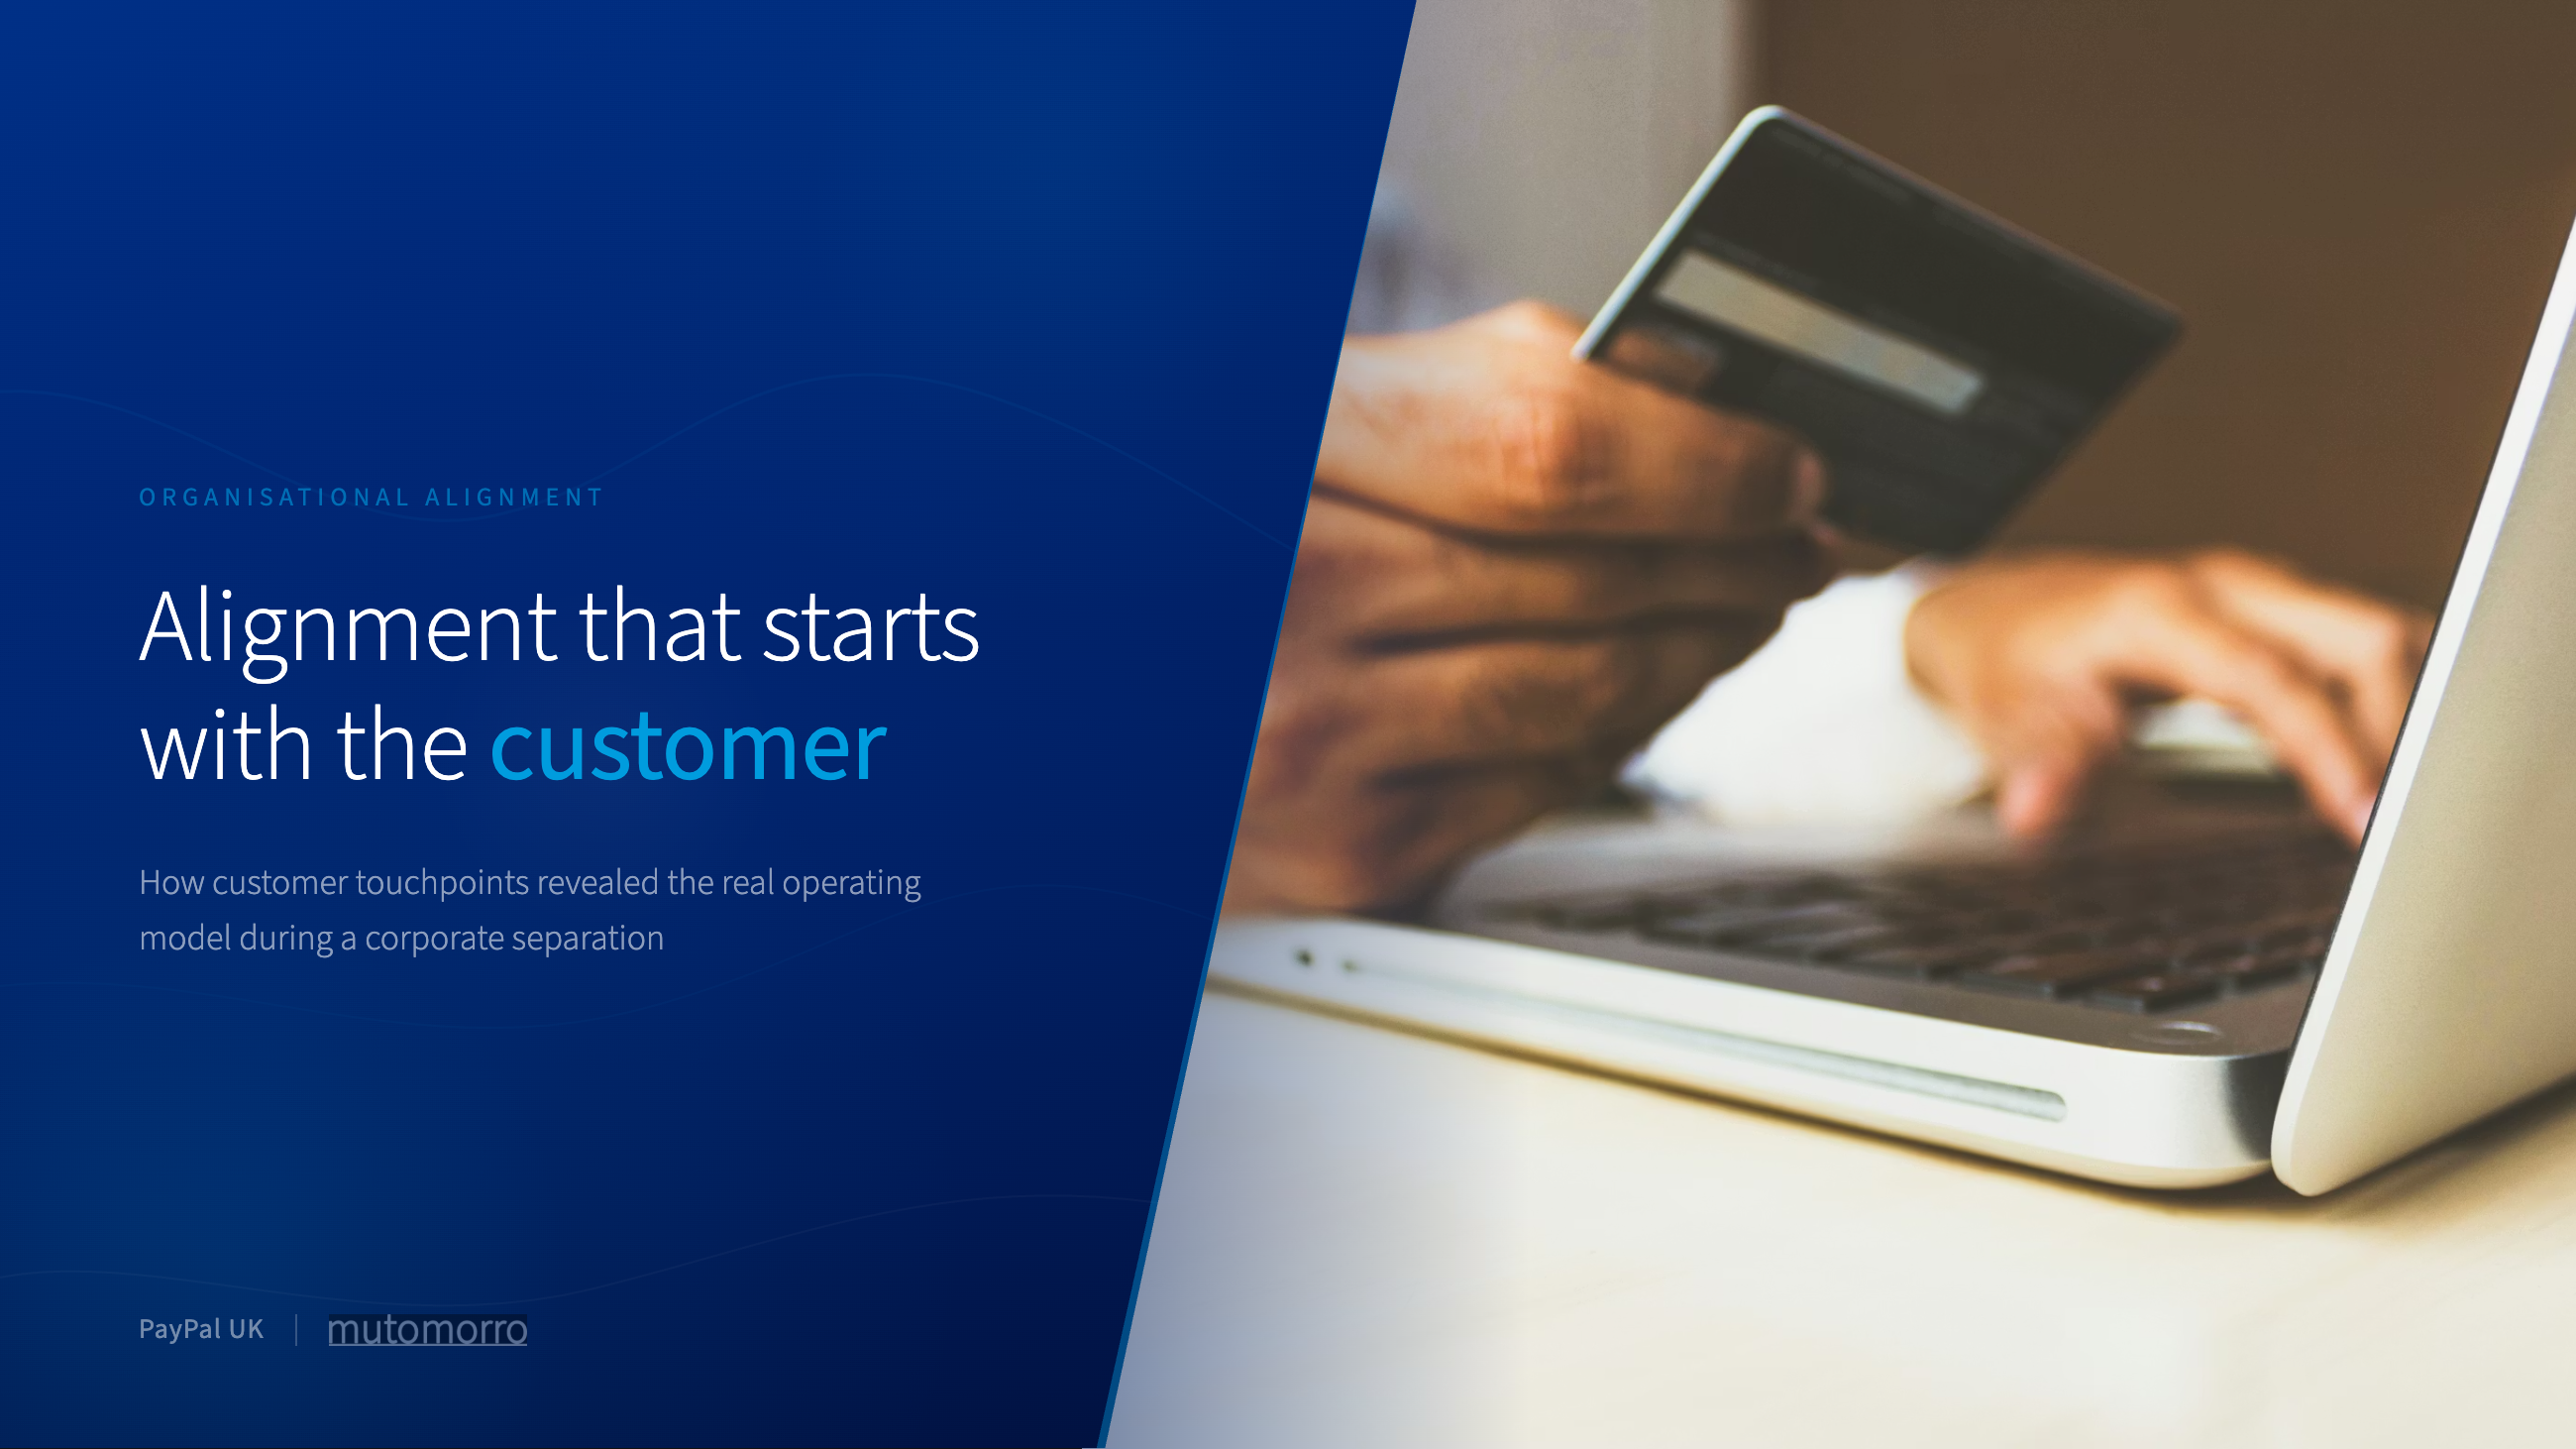
Bringing six departments together into one organisation customers could recognise
When a global payments company prepared for independence, the challenge wasn't rebranding - it was building organisational coherence across six departments that had never needed to work as one.
Read case study →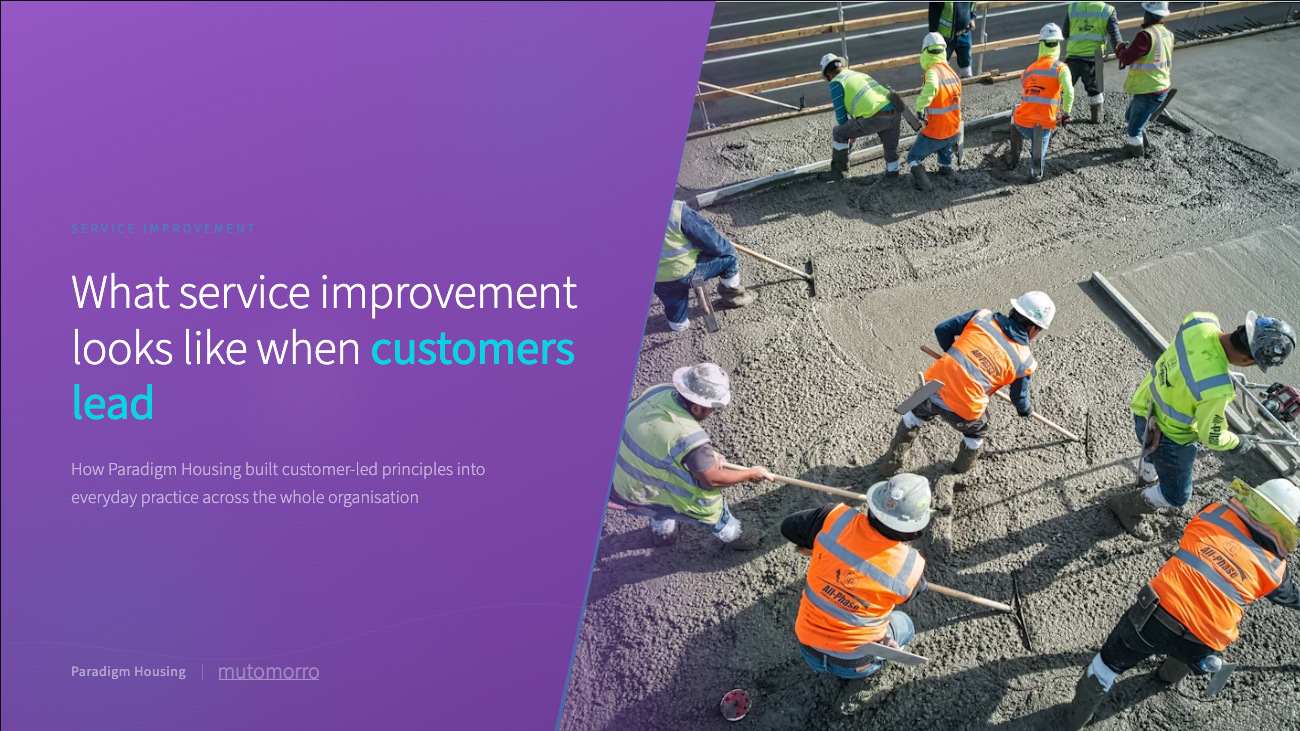
Service improvement led by customers and teams, not handed down by consultants
A growing housing association where staff could recite the values but customers experienced something different - and previous improvement efforts kept addressing symptoms rather than causes. Getting every team working to one standard of service, rather than handing customers between them, was the real job.
Read case study →Most operational improvement focuses on the visible system - processes, workflows, tools. We work with the conditions underneath that determine whether it functions well.
Ways of working design gives you a future-state value stream design: a clear picture of how work will flow from request to delivery, with the queues removed, the handoffs redrawn, the decisions assigned and the cadence set - backed by a map of how the work flows today and a plan to get from one to the other. We design it with the people who run the work, so the result is genuinely theirs.
Ways of Working Rollout takes your Ways of Working design and makes it real across the organisation: standardised processes in daily use, clear roles and decision rights, an installed daily and weekly management system, and performance measures every team acts on. It is the programme that gets the new way of working running, team by team, until it holds without us in the room.
Continuous improvement keeps your new ways of working fit and improving, and builds your own people's ability to run them. Your teams run the improvement cycles and the daily management routines themselves, and you can keep us on a light ongoing rhythm as a critical friend to your improvement work, at a cadence you set.
Process mapping is a visual method for documenting how a process works from start to finish. It helps teams see the full picture - every step, decision point, and handoff - so they can spot problems and design improvements.
The 8 Wastes of Lean give you eight categories for finding where effort, time and resources leak from a process. Use the DOWNTIME acronym to work through each waste type systematically and build a clear picture of what to improve.
The 5 Whys is a simple root-cause analysis technique that drills into problems by asking "why?" repeatedly. It helps teams get past surface-level symptoms to find the real cause of an issue.
A Gemba Walk is a Lean practice where leaders go to the place where work actually happens to observe, listen, and understand. It bridges the gap between how leaders think work gets done and how it really gets done.
DMAIC (Define, Measure, Analyse, Improve, Control) is a structured problem-solving method from the Six Sigma toolkit. It gives teams a clear five-step process for improving existing processes using data and evidence.
Every organisation has friction - the unnecessary effort, the needless complexity, the things that make simple work harder than it should be. This article explores how to find it, understand where it comes from, and reduce it without creating new problems in the process.
Most organisations know they should measure their impact. Fewer know how to do it in a way that's genuinely useful rather than just generating reports. This article explores how to build an impact measurement framework that helps you understand what's working, learn from what isn't, and make better decisions.